Download

1 / 24
240 likes | 406 Views
Learning the Scientific Method using Experimental Design. Mr. Hamm Boyceville High School Science Department Boyceville , WI. Is there a “Scientific Method?”. NO!!! Simply a loosely-bound set of rules/methods to ensure proper experimental testing

E N D
Learning the Scientific Method using Experimental Design Mr. Hamm Boyceville High School Science Department Boyceville, WI
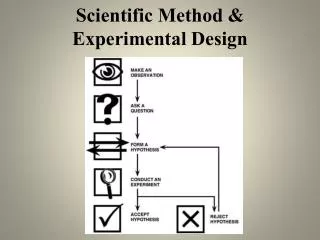
Is there a “Scientific Method?” • NO!!! • Simply a loosely-bound set of rules/methods to ensure proper experimental testing • Rules/methods are consistent and fixed, but the specifics may change from experiment to experiment • Different experiments require different specifics but the same general format
a. Statement of Problem (2 pts) • Not a yes/no question • How does… • Must include independent & dependent variables • How does the mass of a paper airplane affect its flight time? • Problem is clearly testable and written in a concise manner • How does the mass of a ball affect the time it takes for it to fall from the ground when dropped from a given height?
b. Hypothesis (4 pts) • Statement predicts a relationship or trend • If…then statements work best • If the plane has a higher mass then it will fly for a longer time • Statement gives a specific direction to the prediction • Take a stand…who cares if you are wrong! • Consider the hypothesis above INSTEAD OF: • If the plane’s mass is changed then it will fly for a different amount of time
b. Hypothesis (cntd) • Prediction includes both independent & dependent variables • Mass of Plane, measured in grams: Independent Variable • Flight Time, measured in seconds: Dependent Variable • Independent Variable: The variable that you change in an experiment • Dependent Variable: The variable that you measure in an experiment (the variable that depends on the IV) • A rationale is provided for the hypothesis • The flight time for the plane will be longer if its mass is increased because it has additional inertia.
c. Independent Variable (3 pts) • Correctly identify the independent variable (the variable that you change) • Operationally identify the independent variable (how is it changed in your experiment, how is it measured, what are its units, etc.) • State at least three levels of this variable • A level is a specific value with unit • Planes with a mass of 2 g, 4 g, 6 g • Balls of mass 10 g, 20 g, 30 g • Ramps of height 5 cm, 10 cm, 15 cm, 20 cm (4 levels)
c. Dependent Variable (3 pts) • Correctly identify the dependent variable • The variable that is being measured • The variable that changes with respect to the independent variable (depends on the IV) • Operationally identify the dependent variable • How is it measured in the experiment? • Units? Tools to measure the DV? • How is it used in the experiment?
c. Controlled Variables (4 pts) • Controlled variables are other variables OTHER THAN the independent or dependent variables that are controlled (held constant) in an experiment • The same style of plane is used • The same type of paper is used • The paper plane is released from the same height • The plane is timed by the same person every time • The plane is flown in the same location every time • The plane is released by the same person every time • Etc…
d. Experimental Control (2 pts) • Standard of Comparison • The value of the dependent variable when the independent variable is minimized or absent, whichever is more applicable • NOT one of your levels of IV if possible • Provide a reason for your selection of the Experimental Control • The experimental control is the flight time for a paper plane of mass 5 g because that is the lightest paper plane that can be made with these supplies.
e. Materials (3 pts) • All materials used are listed (one material per line) • No extra materials are listed • Materials are listed by their proper name • Material list is separate from the procedure
f. Procedure (6 points) • Procedure a numbered list, when each additional step on a new line • 1….. • 2….. • 3….. • Etc.. • Procedure well organized, experiment can be replicated completely from procedure • Procedure in a logical sequence • Diagrams used • Evidence of repeated trials in procedure
g. Qualitative Observations (4 pts) • Qualitative means quality-based, word-based • Document observations about: • The results • The heavier planes did seem to fly longer • The lighter planes flew for shorter durations of time • The procedure and any deviations you needed • The hallway was too narrow so the flights with the heavier planes were moved outside • The paper plane instructions in the procedure were detailed enough to create a strong, durable plane • Results not directly related to the DV • The heavier planes tended to bank to the right • The lighter planes were harder to fold • Make observations throughout the experiment and report writing exercise.
Quantitative Data (6 pts) • All raw data is given with appropriate units • The data table is condensed with only most important data included (statistics in separate data table) • Table is labeled properly, including proper units, column headings, & row headings • Example calculations given where applicable (not all calculations, but at least one of each type) • All data reported with proper number of Significant Figures
h. Quantitative Data (cntd) Independent Variable (mass of plane) is included Dependent Variable (flight time) is included Standard of Comparison (SOC) is included
i. Graphs (6 pts) • Appropriate type of graph used • Usually a line graph or scatterplot with line of best fit • Graph has descriptive and appropriate title • Units included on graph where needed • Appropriate scale used for graph for both axes • Graph labeled properly for axes and series.
j. Statistics (6 pts) • Create a separate data table for statistics • Include average (mean, median or mode depending on data) and drawn in line of best fit • Include measure of variation (Range, IQR, Standard Deviation) • Include Equation for Line of Best Fit (Regression Analysis) • Include one other appropriate statistic based on data • Measure of Central Tendency – Mean, Median, Mode • Remember your sample calculations
k. Analysis & Interpretation of Data (4 pts) • All data are interpreted and discussed • The heavier planes flew for longer times • The lighter planes flew for shorter times • The planes were relatively consistent, with only a couple of outliers • Unusual data points (outliers) are commented on • The long flight time for the 15 g plane was the result of the timer forgetting to stop the timer • The short time for the 20. g plane was a result of it hitting the wall.
k. Analysis and Interpretation of Data (cntd) • Trends in data explained and interpreted • As the data shows, the heavier the plane, the higher the flight time. This is supported by the positive value for the slope of the line of best fit as well as the increase in average flight times as the mass of the plane increased • Enough detail is given to understand the data without even seeing the data table. All statements must be supported by the data. • As the data shows…
l. Possible Experimental Errors (3 pts) • Possible reasons for the errors are given • The heavy plane hit the wall because it was released at the wrong angle • The light plane didn’t fly well because it was hastily built and wasn’t folded correctly • Important info about data collection given • The planes were launched in a hallway that wasn’t wide enough, causing the planes to strike the walls often. • Effect errors had on data discussed • Since the planes hit the wall, this resulted in premature landing and shorter flight times, causing the average to be lower than expected and possibly clouding up the identification of a trend.
m. Conclusion (4 pts) • Hypothesis is re-stated • If the plane has more mass as measured in grams, then it will fly for a longer duration, measured in seconds. • Hypothesis is evaluated according to data • According to the data, this hypothesis is supported based on the slope of our line of best fit being positive and the general increase in average flight time as plane mass was increased.
m. Conclusion (cntd) • Reasons to accept/reject hypothesis given • Do NOT prove/disprove hypothesis • Hypothesis is either supported or refuted by evidence, causing you to either accept or reject your hypothesis. • No middle ground on this…either accept it or reject it. • All statements must be supported by the data • As the data shows…
n. Applications and Recommendations for Further Use (4 pts) • Suggestions for improvement of specific experiment • A wider hallway would result in fewer experimental errors • A wider range in the levels of the independent variable would provide stronger evidence • More trials are needed to obtain more evidence • Suggestions for other ways to look at hypothesis given • Was your justification wrong? If so, why? • Can you look at the science behind the hypothesis differently?
n. Applications and Recommendations for Further Use (cntd) • Suggestions for further experiments given • Are there other variables to consider? • Could you use the same supplies to check other independent variables and if they also affect the dependent variable? • Does size of plane (surface area) affect flight time? • Does length of plane affect flight time? • Practical application(s) of experiment • Longer duration means more lift, more stability…maybe apply to commercial flight?