Download
1 / 19
200 likes | 322 Views
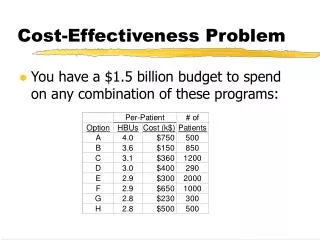
Summary of Energy Efficiency Cost-effectiveness Issues. October 17, 2008 Snuller Price, E3. Agenda. Overview of Key Cost-effectiveness Issues High level discussion as background for our panelists

E N D
Summary of Energy Efficiency Cost-effectiveness Issues October 17, 2008 Snuller Price, E3
Agenda • Overview of Key Cost-effectiveness Issues • High level discussion as background for our panelists • Materials are based on work E3 and RAP are doing for the National Action Plan for Energy Efficiency
Key Cost-effectiveness Issues • Definition of cost-effectiveness tests • Cost-effectiveness tests to use • Point of cost-effectiveness measurement • Calculation of avoided costs • Discount rate • Net to gross ratio and free-riders • Emissions savings and RPS impact • Non-energy benefits
Summary of Costs and Benefits • High level summary of costs and benefits included in each cost test • Each state adjusts these definitions depending on circumstances • Details can significantly affect the type of energy efficiency implemented
Example Cost Test Results • Benefit / Cost ratio results from three programs • Energy efficiency is widely cost-effective • RIM test results are often less than one
Application at portfolio level allows for inclusion of individual programs or measures that do not past cost test Low Income, emerging technologies, market transformation Point of Cost-Effectiveness Measurement
RIM Test can be controversial • RIM Test fails to capture the change in rates over time which can vary Action Plan and LBNL have developed the ‘EE Benefits Calculator’ which can estimate the rate trajectory over time
Electric Avoided Cost Components • Range of avoided cost components that are considered in developing the benefits for EE • Each state selects their own elements and methods for quantification
Methodology of Avoided Costs • Methodology depends on market structure • Lots of variation across states
Time specific avoided costs Example from California Avoided Cost Analysis
Net To Gross (NTG) Ratio • Net to gross ratio may deratethe program impacts and significantly affects the results of the TRC, SCT, PAC, and RIM tests • Difficult to estimate the NTG with confidence • Key factors addressed through the net-to-gross ratio are: • Free Riders • Installation Rate • Persistence/Failure • Rebound Effect • Take Back Effect • Spillover • Are incentives and/or measure costs for free riders a cost in TRC? • Perspective 1: Incentives to free-riders are an unproductive cost to non-participants and should be counted as a cost and not a transfer • Perspective 2: These are an intra-regional transfer and should be excluded under the TRC just as incentives to other participants are
GHG Emissions Savings from EE • Carbon savings profile can vary significantly
Value of Carbon Adder • Simple Calculation of Value • At $30/tonne CO2, natural gas combined cycle costs increase about $0.012/kWh and coal $0.027/kWh
Including RPS in Avoided Cost California Example Assuming a 20% RPS Target 20% RPS by 2020 (1%/yr reduction in demand) 20% RPS by 2020 (Business-as-usual scenario) • Reducing demand 1%/yr saves 9 TWh of RPS generation @ $0.123/kWh • Results in ~$8.03/MWh higher avoided cost if included • Change in avoided cost = ($124/MWh - $82.75/MWh) * 20%
Categories of Non Energy Benefits • Customer perspective • increased comfort • improved air quality • greater convenience. • Utility perspective • Reduced shut-off notices • Reduced bill complaints • Societal Perspective: • Increased community health • Improved aesthetics. • Reduces reliance on imported energy sources
Any questions? Contact Information Snuller Price, Partner 101 Montgomery Street, 16th Floor San Francisco, CA 94104 snuller@ethree.com (415)391-5100 phone