Download
1 / 1

E N D
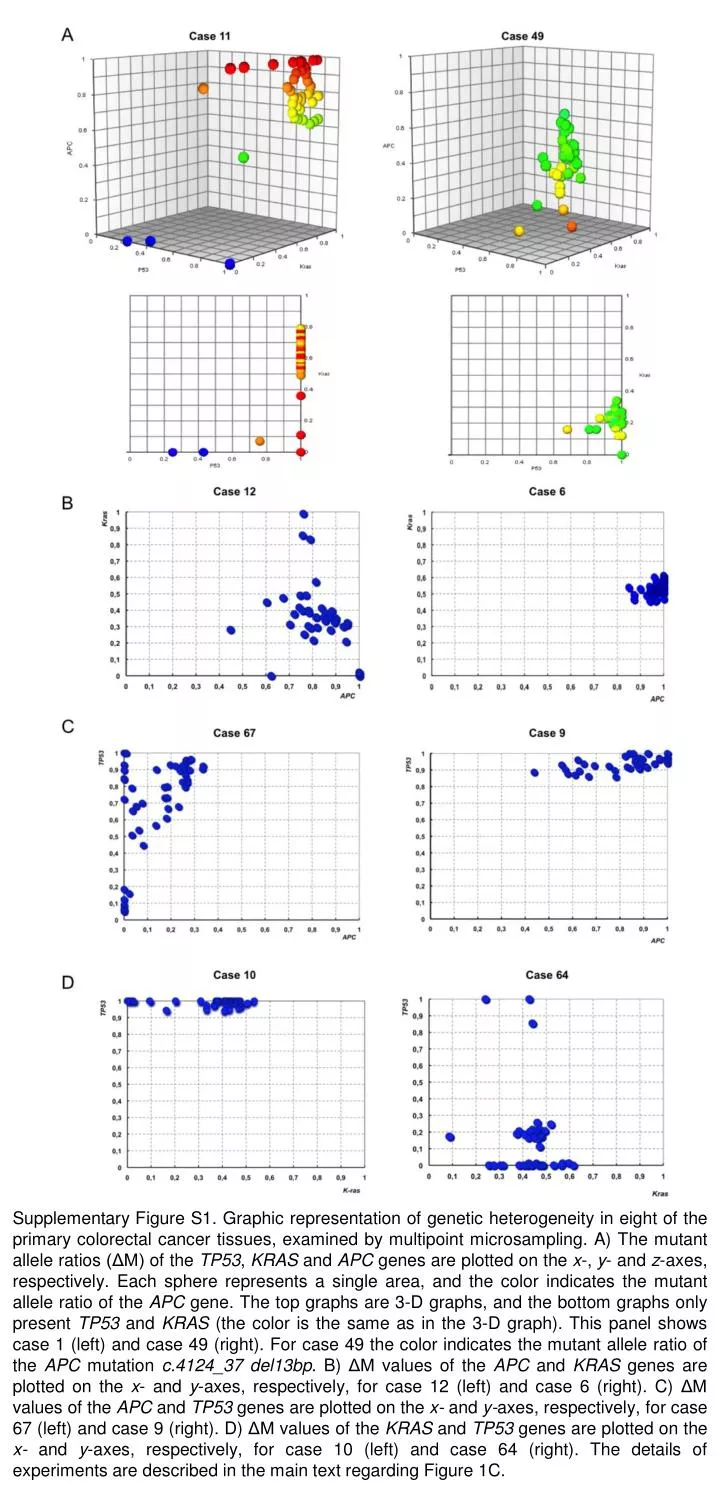
Supplementary Figure S1. Graphic representation of genetic heterogeneity in eight of the primary colorectal cancer tissues, examined by multipoint microsampling. A) The mutant allele ratios (ΔM) of the TP53, KRAS and APC genes are plotted on the x-, y- and z-axes, respectively. Each sphere represents a single area, and the color indicates the mutant allele ratio of the APC gene. The top graphs are 3-D graphs, and the bottom graphs only present TP53 and KRAS (the color is the same as in the 3-D graph). This panel shows case 1 (left) and case 49 (right). For case 49 the color indicates the mutant allele ratio of the APC mutation c.4124_37 del13bp.B) ΔM values of the APC and KRAS genes are plotted on the x- and y-axes, respectively, for case 12 (left) and case 6 (right). C) ΔM values of the APC and TP53 genes are plotted on the x- and y-axes, respectively, for case 67 (left) and case 9 (right). D) ΔM values of the KRAS and TP53 genes are plotted on the x- and y-axes, respectively, for case 10 (left) and case 64 (right). The details of experiments are described in the main text regarding Figure 1C.


![2011 ITRS Emerging Research Materials [ERM] July 10-13, 2011](https://cdn2.slideserve.com/4220097/2011-itrs-emerging-research-materials-erm-july-10-13-2011-dt.jpg)