Download

1 / 11
110 likes | 238 Views
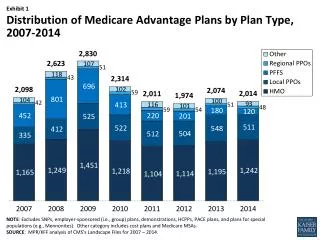
Distribution of Medicare Advantage Plans by Plan Type, 2007-2014. NOTE : Excludes SNPs, employer-sponsored (i.e., group) plans, demonstrations, HCPPs, PACE plans, and plans for special populations (e.g., Mennonites). Other category includes cost plans and Medicare MSAs.

E N D
Distribution of Medicare Advantage Plans by Plan Type, 2007-2014 NOTE: Excludes SNPs, employer-sponsored (i.e., group) plans, demonstrations, HCPPs, PACE plans, and plans for special populations (e.g., Mennonites). Other category includes cost plans and Medicare MSAs. SOURCE: MPR/KFF analysis of CMS’s Landscape Files for 2007 – 2014.
Number of Medicare Advantage Plans Available, by Plan Availability Status, 2013 and 2014 Each is equivalent to about 6 plans 2,014 plans available in 2014 349discontinued plans 289 new plans 1,725 plans continuing from 2013 to 2014 2,074 plans available in 2013 NOTE: Excludes SNPs, employer-sponsored (i.e., group) plans, demonstrations, HCPPs, PACE plans, and plans for special populations (e.g., Mennonites). SOURCE: MPR/KFF analysis of CMS’s Landscape Files for 2013 – 2014.
Share of Medicare Beneficiaries with Access to One or More Medicare Advantage Plans, By Plan Type, and Metropolitan Status of County, 2014 NOTE: Excludes SNPs, employer-sponsored (i.e., group) plans, demonstrations, HCPPs, PACE plans, and plans for special populations (e.g., Mennonites). The total includes cost and MSA plans, which are not shown separately. Plans in the territories are included in the total, but not in the urban/rural categories. SOURCE: MPR/KFF analysis of CMS’s Landscape and Penetration Files for 2014.
Distribution of Special Needs Plans by Plan Type, 2007-2014 NOTE: Excludes employer-sponsored (i.e., group) plans, demonstrations, HCPPs, PACE plans, and plans for special populations (e.g., Mennonites). SOURCE: MPR/KFF analysis of CMS’s Landscape Files for 2007 – 2014.
Percent of Medicare Beneficiaries with One or More Medicare Advantage Plans Available from Particular Firms, 2014 Wellpoint BCBS affiliates Other BCBS affiliates NOTE: Excludes SNPs, employer-sponsored (i.e., group) plans, demonstrations, HCPPs, PACE plans, and plans for special populations (e.g., Mennonites). BCBS affiliates are BlueCross BlueShield affiliates. This analysis only includes Wellpoint plans offered by the BCBS affiliated lines of business. SOURCE: MPR/KFF analysis of CMS’s Landscape and Penetration Files for 2014
Unweighted Average Monthly Premiums for Medicare Advantage Prescription Drug Plans, 2011-2014 NOTE: Excludes SNPs, employer-sponsored (i.e., group) plans, demonstrations, HCPPs, PACE plans, and plans for special populations (e.g., Mennonites). Includes only Medicare Advantage plans that offer Part D benefits. The total includes cost plans, which are not shown separately, as well as plans with zero premiums. All numbers are rounded to the nearest dollar. SOURCE: MPR/KFF analysis of CMS’s Landscape Files for 2011 – 2014.
Weighted Average Monthly Premiums for Medicare Advantage Prescription Drug Plans, Total and by Plan Type, 2013-2014(2014 Weighted by 2013 Enrollment; Includes Plans Available in Both 2013 and 2014) % Change, 2013 to 2014 +14% +13% +15% +19% +27% NOTE: Excludes SNPs, employer-sponsored (i.e., group) plans, demonstrations, HCPPs, PACE plans, and plans for special populations (e.g., Mennonites). Includes only Medicare Advantage plans that offer Part D benefits. The total includes cost plans, which are not shown separately, as well as plans with zero premiums. Weighted monthly premiums assume that enrollees remain in the same plan from one year to the next. Calculations take into account service area changes. SOURCE: MPR/KFF analysis of CMS’s Landscape Files for 2013 – 2014, CMS’s 2014 Part C and D Crosswalk file, and September 2013 Enrollment file.
Share of Beneficiaries with Access to Medicare Advantage Prescription Drug Plans with No Additional Premium, Total and by Plan Type, 2011-2014 NOTE: Excludes SNPs, employer-sponsored (i.e., group) plans, demonstrations, HCPPs, PACE plans, and plans for special populations (e.g., Mennonites). Includes only Medicare Advantage plans that offer Part D benefits. The total includes cost plans, which are not shown separately. Calculations reflect service area changes. SOURCE: MPR/KFF analysis of CMS’s Landscape and Penetration Files for 2011 – 2014
Distribution of Medicare Advantage Plans’ Out-of-Pocket Spending Limits, by Plan Type, 2011-2014 NOTE: Excludes SNPs, employer-sponsored (i.e., group) plans, demonstrations, HCPPs, PACE plans, MSAs, and plans for special populations (e.g., Mennonites). Percentages are unweighted by enrollment. Totals may not add to 100% due to rounding. PFFS plans not shown because 98% of PFFS plans were missing limits in 2013 and 2014. SOURCE: MPR/KFF analysis of CMS’s Landscape Files for 2014.
Share of Medicare Advantage Prescription Drug Plans, by Coverage in the Gap, 2007-2014 % of plans offering drug coverage 75% 73% 73% 79% 80% 81% 82% 83% NOTE: Excludes SNPs, employer-sponsored (i.e., group) plans, demonstrations, HCPPs, PACE plans, MSAs, and plans for special populations (e.g., Mennonites). Includes only Medicare Advantage plans that offer Part D benefits. Percentages are unweighted by enrollment. Totals may not add to 100% due to rounding. All plans that cover brand name drugs in the coverage gap also cover generic drugs in the gap. Less than 1% of plans in 2010 - 2014 cover all brands and generics in the gap. SOURCE: MPR/KFF analysis of CMS’s Landscape Files for 2007-2014.
Share of Medicare Advantage Prescription Drug Plans, by Coverage in the Gap and Plan Type, 2014 NOTE: Excludes SNPs, employer-sponsored (i.e., group) plans, demonstrations, HCPPs, PACE plans, and plans for special populations (e.g., Mennonites). Includes only Medicare Advantage plans that offer Part D benefits. Percentages are unweighted by enrollment. Totals may not add to 100% due to rounding. All plans that cover brand name drugs in the coverage gap also cover generic drugs in the gap. The total includes cost plans, which are not shown separately. SOURCE: MPR/KFF analysis of CMS’s Landscape Files for 2014.