Download
1 / 16
160 likes | 300 Views
Visualizing Massive Multi-Digraphs. James Abello Jeffrey Korn Information Visualization Research Shannon Laboratories, AT&T Labs-Research All the graphs copied from “Visualizing massive Multi-Digraphs”. Massive Graph Visualizer (MGV).

E N D
Visualizing Massive Multi-Digraphs James Abello Jeffrey Korn Information Visualization Research Shannon Laboratories, AT&T Labs-Research All the graphs copied from “Visualizing massive Multi-Digraphs”
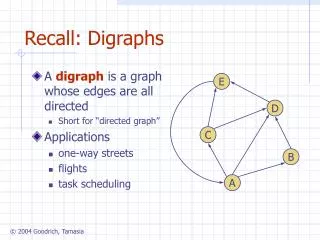
Massive Graph Visualizer (MGV) • Visualization and exploration system for massive multi-digraph navigation. • Assumes a vertex set of the underlying digraph corresponds to leave sets. • Out-of-core graph hierarchy and visual representation of each hierarchy slice. • Implemented in C and Java 3D. • Applied in geographic information systems, telecommunications traffic and internet data …
Problems with data visualization • Massive data size • Bottlenecks • I/O bandwidth • Screen • Solution Hierarchical graph slices
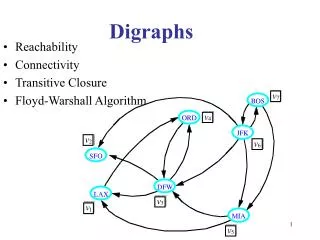
Traditional graph representation Traditional nodes and edges representation of a fully connected graph with 20 nodes
Hierarchical graph slice rationale(1) • Build hierarchical multi-digraph layers on top of input multi-digraph. • Each layer is obtained from coalescing disjoint sets of vertices at previous level • In short, convert multi-digraph data into hierarchical data structure. V sets, E sets Root, Leaves, Height
Hierarchical graph slice rationale(2) • Layer of each level is a subgraph with vertex and edges , so called Hierarchical Graph Slices. • On each slice, less nodes, much less edges.
Handling two bottlenecks • The original graph is in the external memory,tree is computed and stored in RAM. Engine needs to computes one slice for interface at a time upon request. • Panoramic 3D display provides hierarchical and horizontal navigation thru all nodes and edges.no information lost
Slice View Interfaces • MGV provides flexible interface. • Works on adjacency representation matrix.similar to representation of Needle Grid. • Handle massive data :AT&T call detail multi-digraph has 275million daily increment on 260 million vertices.
Needle grid • Edge maps into a little tick • Lines weighted By color, length, width, orientation
Star Maps • Rearrange matrix into circular histogram • Well focused • Detail data triggered By mouse
Multi-comb • stack of star maps,single object represent aggregated view of millions of edges. • 3D coordinates facilitates data evaluation. • Useful for animation of data evolution
Multi-wedge • Each wedge is the distribution spectrum of a state. • 2D
Aggregated views • Simply splice the segment to single bar • User move the cursor into the bar for part information
Usability metrics • Ease of Use & Navigation • Good First Impression • High User Retention over Time • High Learnability • Lesser number of user errors
Conclusion on MGV • Computational engine + Java based user interface • Engine runs at a web server, communication thru XML. • Java provides fast rendering • Hierarchical algorithm facilitates navigation on slice, actually integrates visualization and computation. • Large class of massive data sets.