Download
1 / 13
130 likes | 222 Views
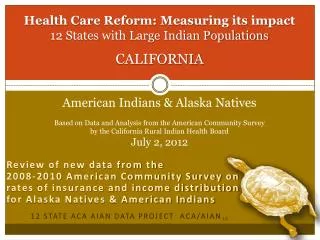
Health Care Reform: Measuring its impact in 33 States with IHS funded health programs American Indians & Alaska Natives July 26, 2012. Review of New Data from the 2008-2010 American Community Survey on rates of insurance and income distribution for Alaska Natives and American Indians

E N D
Health Care Reform: Measuring its impactin 33 States with IHS funded health programsAmerican Indians & Alaska NativesJuly 26, 2012 Review of New Data from the 2008-2010 American Community Survey on rates of insurance and income distribution for Alaska Natives and American Indians 33 State ACA AIAN Data Project ACA/AIAN12 www.edfoxphd.com
33 State level impact analysis * It is possible, but not easy, to get rates of uninsured for each category. ** Some of the 33% under 138% of poverty are now insured under early expansion bridge waiver for basic health. • 1st step: How many AIANs are there? 4,095,371 (33 states) estimated AIAN alone & in combination 4, 900,000 in all 50 states • 2nd step: What is rate of private insurance? 45.6% 1.9 million AIANs have private insurance 30% 1.2 million report access to IHS paid services 27% 1.1. million have Medicaid • 3rd step: What is number and rate of uninsured? 27% 1.1 million uninsured • 4th step: Determine income distribution of uninsured across 3 income categories.* • 36% under 138% of Federal Poverty Level (FPL), ** • 42% 138 to 400%of FPL • 21% over 400% of FPL • 5th step: Use estimates to provide information needed for planning outreach & education, workforce, facilities, budgets for all. • 6th step: Remember these are estimates, check with reality as it becomes known, make no assumptions, remember error rates.
The American Community Survey Three-year data2008-2010 surveys pooled data released 10/27/11, w/ add’l releases Dec. ’11 • State, County, and Metropolitan Area data for areas w/ ≥ 20,000 AIAN alone & in comb. • Health Insurance data partially available (most reliable data thus far for AIANs – question on health insurance first asked in 2008, allowing 1st time 3-yr data is avail.) • Current release does not report Medicaid or Medicare separately, but as public coverage • In addition it includes, for the first time, information on the perception of IHS ‘coverage’ and Income distribution for AIANs:
Questions on the ACS The health insurance question asks the respondent to give a separate answer for each member of household regarding health insurance coverage, including: Employer Sponsored Insurance (ESI) Private, paid by individual Medicare Medicaid Tricare, Health care insure for military and families VA, Veteran’s Administration IHS coverage-not used to compute rates of insurance Question on insurance is ‘point in time’ or ‘current coverage’ not the coverage in the ‘past year’ asked in some surveys. It is generally believed that Medicaid is underreported.
Limitations of ACS data • Estimates are based on survey samples: • do not have calculated error rates to inform the range of uncertainty in the estimates • However, three years of data for Oklahoma have over 10,000 responses and Washington’s data includes more than 6300 responses from self-identified AIANs • As the first set of 3-year estimates, it is relatively new and little research has examined its relative accuracy. Example: there is some evidence that it underestimates Medicaid coverage by a couple points • Uninsured is calculated when a respondent answers: • no to all 6 types of health insurance coverage • Note: IHS is not considered coverage
ACS and Urban Indians Arizona, Alaska,California, Oregon, Oklahoma, Minnesota, New Mexico, and Washington all have very large Urban Indian populations. ACS has income and insurance data for metropolitan areas in each of these states. In addition, County level, data is available for Arizona, California, Oklahoma, New Mexico, and Washington.