Download
1 / 45
450 likes | 570 Views
Commissioned by the Metropolitan Human Services Commission. Community Profile 2013 Tulsa County. Prepared by the Community Service Council January 2013. tulsa County. Demographic Trends Economics and Employment Health Indicators. Demographics. DEMOGRAPHIC TRENDS.

E N D
Commissioned by the Metropolitan Human Services Commission Community Profile 2013Tulsa County Prepared by the Community Service Council January 2013
tulsaCounty • Demographic Trends • Economics and Employment • Health Indicators Demographics
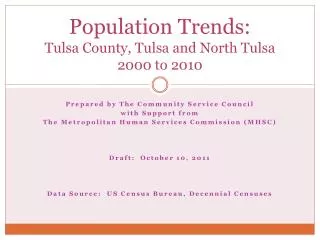
Population change--migration to suburban areas of Tulsa and Oklahoma City MSA with an overall decrease in new births Age--aging population Race and ethnicity--more culturally diverse Living arrangements--transitional for family living arrangement Demographic Trends Demographics
Demographics Prepared by the Community Service Council of Greater Tulsa
Lack of health insurance • Limited access to preventative services • Living in high risk families • Living in a state with a high level of premature death Why are children at risk? Child Indicators Prepared by the Community Service Council of Greater Tulsa
Major American research project that poses the question of whether and how childhood experiences affect adult health decades later • Provides compelling evidence that: • Adverse childhood experiences are surprisingly common • ACE’s happen even in “the best of families” • ACE’s have long-term, damaging consequences • Findings reveal powerful relationships between emotional experiences as children and physical and mental health as adults The Adverse Childhood Experiences (ACE) Study Child Indicators Source: The Adverse Childhood Experiences Study website: www.acestudy.org, “About the Adverse Childhood Experiences Study.”
The Adverse Childhood Experiences (ACE) Study Pyramid Death Child Indicators Conception Mechanisms by which Adverse Childhood Experiences Influence Health and Well-being throughout the Lifespan Source: The Adverse Childhood Experiences Study website: www.acestudy.org, “About the Adverse Childhood Experiences Study.”
Adverse Childhood Experiences… …growing up in a household with: • Recurrent physical abuse • Recurrent emotional abuse • Sexual abuse • An alcohol or drug abuser • An incarcerated household member • Someone who is chronically depressed, suicidal, institutionalized or mentally ill • Mother being treated violently • One or no parents • Emotional or physical neglect Child Indicators Source: The Adverse Childhood Experiences Study website: www.acestudy.org, “What are Adverse Childhood Experieinces (ACE’s).”
…Lead to Health-Risk Behaviors… • Smoking • Overeating • Physical inactivity • Heavy alcohol use • Drug use • Promiscuity Child Indicators Source: The Adverse Childhood Experiences Study website: www.acestudy.org
…Which Cause Disease, Disability and Social Problems in Adulthood • Heart disease • Cancer • Chronic lung and liver disease • Stroke • Diabetes • Sexually transmitted diseases • Nicotine addiction • Alcoholism • Drug addiction • Obesity • Depression • Suicide • Injuries • Unintentional pregnancy Child Indicators Source: Felitti, Vincent J., “The Relationship of Adverse Childhood Experiences to Adult Health: Turning gold into lead;” CDC Media Relations, May 14, 1998, “Adult Health Problems Linked to Traumatic Childhood Experiences.”
Child Indicators Prepared by the Community Service Council of Greater Tulsa
In Tulsa County in FY 2011, there were 4,362 reports of child abuse and/or neglect accepted for investigation or assessment. 6,526 children were involved in these reports (duplicated count). 1,023 children were confirmed victims of child abuse and/or neglect. 115 were abused, 785 were neglected, 123 were victims of both abuse and neglect. Nearly 7 of every 1,000 children in Tulsa County are victims of abuse and/or neglect. In Oklahoma, the rate is just under 9 of every 1,000 children. Oklahoma ranks #35 in the nation in the rate of children who are victims of abuse and/or neglect. Parents make up 77.3% of all perpetrators, followed by “no relation” at 6.3%, step-parents at 6.2%, and grandparents at 3.3%. Substance abuse is a major contributing factor to child neglect. Child Abuse & Neglect Child Indicators Prepared by the Community Service Council of Greater Tulsa
Crime & Incarceration Prepared by the Community Service Council of Greater Tulsa
Parental separation or divorce 49 Incarcerated household member 76 Mentally ill household member 77 Substance abusing household member 76* Violence against mother 57 Psychological, physical & sexual abuse 12 Emotional & physical neglect 4 Overall ranking 31 Rankings: 1 = best, 77 = worst *Indicates a tie with at least one other county Adverse Childhood Experiencestulsa County Rankings Child Indicators Source: Oklahoma 2009 KIDS COUNT Factbook (2005-2007 rankings), Oklahoma Institute for Child Advocacy
Community Profile 2013tulsa County Prepared by the Community Service Council of Greater Tulsa January 2013 …is available on our website: www.csctulsa.org Presentation are available from Jan Figart jfigart@csctulsa.org