Download
1 / 56
590 likes | 712 Views
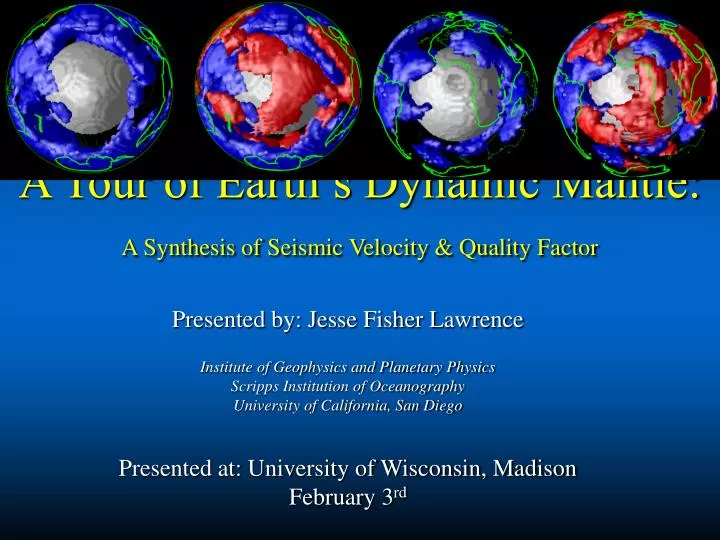
A Tour of Earth’s Dynamic Mantle: A Synthesis of Seismic Velocity & Quality Factor. Presented by: Jesse Fisher Lawrence Institute of Geophysics and Planetary Physics Scripps Institution of Oceanography University of California, San Diego Presented at: University of Wisconsin, Madison

E N D
A Tour of Earth’s Dynamic Mantle: A Synthesis of Seismic Velocity & Quality Factor Presented by: Jesse Fisher Lawrence Institute of Geophysics and Planetary Physics Scripps Institution of Oceanography University of California, San Diego Presented at: University of Wisconsin, Madison February 3rd
Collaborators: • Michael Wysession: Washington University • Doug Wiens: Washington University • Peter Shearer: Scripps • Guy Masters: Scripps • Andy Nyblade: Penn State • Sridhar Anandakrishnan: Penn State
Introduction: Definitions - e.g. Quality Factor & Attenuation Motivation Data Measurement: Case Studies: The Caribbean lower mantle thermal anomaly Antarctic lithospheric study North American upper mantle 3D model of the mantle Conclusions: Talk Outline
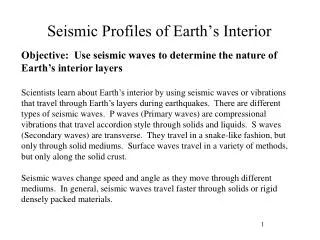
Seismic Velocity ( V ): The speed at which a seismic wave travels through the Earth. Seismic Attenuation ( t* ): The amount of energy a seismic wave looses as it travels through the Earth. Seismic Quality Factor ( Q ): The degree to which the Earth transfers energy without attenuation. Some Definitions
Attenuation (high temp, low stress, & water) Vacancy Vacancy Attenuation (low temp, high stress, & water) Creep: • Creep: is a slow, time-dependent strain where energy is not recoverable. Most commonly used in viscous flow. Diffusion Creep: Reorganization of atoms within a grain or within poor fluids between grains. Dislocation Creep: Through recrystalization, bonds may be broken, moved, and rebuilt without reorganization of the lattice. Vacancy Diffusion Edge Dislocation
Rational for Studying Attenuation • Attenuation & velocity can be used to indicate different sources for anomalies. • Water • Temperature • Chemical [Lawrence & Wysession., 2005: AGU Monograph in review; Karato, 2003: AGU Mohograph]
Rational for Studying Attenuation • Anelasticity is Anelasticity: • Q(T,H2O)n (T ,H2O) • [Karato, 2003; Monograph] • Water increases conductivity. • Increases heat flow • [Li & Jeanloz, 1991; JGR] • Hydrous phases are often anisotropic • [Wookey & Kendall; 2004 JGR] • Water changes melting temperature • [Inoue, 1994; PEPI] [McNamara et al., 2003: JGR]
Introduction: Definitions - e.g. Quality Factor & Attenuation Motivation Data Measurement: Case Studies: The Caribbean small-scale lower mantle thermal anomaly Antarctic lithospheric study North American upper mantle 3D model of the mantle Conclusions: Talk Outline
Radial Tangential Differential Measurements • Travel-Time Residuals • Seismic Velocity • Attenuation • Quality Factor • Anisotropy • Velocity • Quality Factor
Travel-Time Measurement SandScSAlignment • Cross- Correlation
Attenuation Measurement • Cross- Correlation • Attenuation Operator H= ScS/S
Corrected Travel-Time Measurement SandScSAlignment • Cross-Correlation • Attenuation Operator • Repeat Cross- Correlation
Introduction: Definitions - e.g. Quality Factor & Attenuation Motivation Data Measurement: Case Studies: The Caribbean lower mantle thermal anomaly Antarctic lithospheric study North American upper mantle 3D model of the mantle Conclusions: Talk Outline
Caribbean Anomaly Fisher et al., [2003] - GRL
Caribbean Anomaly ScS Path D: 250 km Outer Core Fisher et al., [2003] - GRL
The Caribbean Anomaly • Thermal Anomaly is expected at the CMB. [after Tan & Gurnis, 2002; Grand et al., 1997]
The Story So Far … • Small-scale velocity and quality factor anomalies can be isolated in the lower mantle. • The Caribbean anomaly is likely thermal due to heat flow perturbations at the CMB. But we are are at the surface … And the anomaly is deep in the Earth … Then we have to peel back the layers to really see what is inside
Transantarctic Mountain Seismic Experiement • 42 stations spanned from the Ross Sea 1300 km into East Antarctica. Photos Courtesy of Jen Curtis
Antarctic Lithosphere • Velocity & Attenuation are inversely correlated • 300C difference between East & West Antarctica • Measured crustal thickness • Modeled TAMs uplift as flexural response to thermal load Lawrence et al., [2006a -JGR]
Closer to Home: • New & improved technique • 2 weeks from start to finish not 4 months. • P- waves correlate with S-waves (R2 > 0.6) • Attenuation & travel times are less correlated (R2 < 0.3) [Lawrence, Shearer, & Masters, 2006: in review at GRL]
The Story So Far … • Travel times and attenuation vary significantly for both upper and lower mantle. • Quality factor correlates with velocity indicating thermal anomalies • So, both upper and lower thermal boundary layers possess lateral thermal variations. But we are are at the surface … And we’ve only imaged a small part of the Earth So, what about the Earth as a whole?
VQM3DA • V - Velocity • Q - Quality Factor • M - Whole Mantle • 3D - 3 Dimensional • A - Anisotropy [Lawrence & Wysession, 2006: in review G-cubed]
Juliana Rokosky Emily Carter Tracy Portle Kurt Solander DATA Data used: †for Radial Component Only * Uses VanDecar and Crosson, [1990]
Velocity: Quality Factor: Tomography Ray Tracing:
Quality Factor&Velocity • Velocity has poor correlation with seismic velocity. • A ring of high velocity high quality factor is clear around the Pacific. • There is a large, very low Q anomaly between 800 and 1500 km depth. [Lawrence & Wysession., 2006: in reviewAGU Monograph]
QRLW8: • From surface waves • Looses resolution with depth Gung & Romanowicz [2004] • VQM3DA: • From body waves • Gains resolution with depth Lawrence & Wysession [2006] VQM3DAv.QRLW8 • VQM3DA is more accurate in the lower mantle than in the upper mantle. • Even in the upper mantle it has excellent resolution. • In the upper mantle, the highest attenuation occurs at subduction zones due to dehydration effects.
Upper Mantle Dehydration Melt: • Water subducts within hydrous minerals such as serpentine • At 100-400 km depth the hydrous minerals become unstable • Water is released into the mantle above the slab • Peacock [1990] estimates a net flux of ~6.7 1011 kg/year water into the mantle. +100% -120% dln 1/Q [Roth & Wiens, 1999: JGR]
The Transition Zone Water Filter: • Water enters mantle at subduction zones. • Upper mantle is generally anhydrous. • Transition zone sucks up the water. • Lower mantle is generally anhydrous. [Bercovici et al., 2003: Nature]
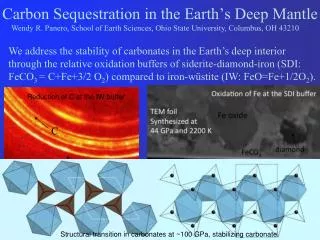
Hydrous Phases B & D: • Quench-type experiments: • Pressure: • 20-53 GPa • Temperature: • 800-1800°C • Results: • Phase D is stable to 42 GPa • or ~1400km depth. [adapted from Shieh et al., 1998: EPSL]
The East Asian Anomaly Water Anomaly Anomaly Volume: 1.8 1011 km3 Water Volume: > 5.5 108 km3 (0.1 wt% water) Water in the Oceans: 1.3 109 km3 [Lawrence & Wysession., 2006c: in review AGU Monograph]
Consequences: • Anelasticity is Anelasticity: • Q(T,H2O)n (T ,H2O) • [Karato, 2003; Monograph] • Water increases conductivity. • Increases heat flow • [Li & Jeanloz, 1991; JGR] • Hydrous phases are often anisotropic • [Wookey & Kendall; 2004 JGR] • Water changes melting temperature • [Inoue, 1994; PEPI] [McNamara et al., 2003: JGR]
? ? Megaplumes: [Masters et al., 2001: AGU Monograph] Shear Velocity Quality Factor Pacific Africa
Conclusions • Quality factor & velocity are highly heterogeneous throughout the mantle on very large and very small scales. • Velocity and Quality Factor are often positively correlated indicating thermal anomalies. • Velocity and Quality Factor are often poorly correlated, requiring other sources for the anomalies. • Water likely plays a key role in shaping the anelastic Earth. • There is a second dehydration cycle in the mantle related to subduction. • Vertical profiles through VQM3DA are consistent with core-to-surface communications for spreading ridges and subduction zones.
So, What is the Anomaly? • Temperature: • V & Q change a lot • High T is unlikely above a slab. • Grain Size: • Hard to reconcile with size & magnitude of anomaly • Composition: • Velocity variation? • dln Q is less than observed • Water: • V doesn’t change much. [Lawrence & Wysession., 2006: in review AGU Monograph; Karato, 2003: AGU Mohograph]
The East Asian Anomaly Anomaly [Lawrence & Wysession., 2006: in review AGU Monograph]
3D Rendering of VQM3DA Model: Isotropic Velocity View: South: = 30 Contour: 0.5 %
Compare Q(r) to Temperature Q(z) = e[/TH(z)] = 2.14 1 = 3.45 0.6 • and are controlled by chemical composition and may have some pressure dependence Lawrence and Wysession [2005a]
Anisotropic Velocity = VSH2/VSV2
Anisotropic Quality Factor = QSH2/QSV2
Velocity: Quality Factor: Tomography Inversion: : No net perturbation : Smoothing constraint
What is Anelasticity? • Anelasticity: The property of a solid indicating that deformation depends on the time and stress. Elastic Anelastic Spring Silly Putty
Purely Elastic Anisotropy Slow Direction Fast Direction
Anelastic Anisotropy Anelastic Direction Elastic Direction
SAW16B16AN v. VQM3DA • SAW16B16AN • Uses surface & body waves • Spherical Harmonics Gung et al., [2003] • VQM3DA: • Uses only body waves • Gains resolution with depth Lawrence & Wysession [2006b] VSV-Fast VSH-Fast
1D Quality Factor Structure • S and ScS reach greater depth with distance • Measured 30,000 dt*ScS-S • Excellent global data coverage Lawrence and Wysession [2006 EPSL]
Attenuation vs. Distance ~27,000 Data Points ~3,000 Data Points Lawrence and Wysession [2006 EPSL]
Previous Work Lawrence and Wysession [2006 EPSL]