Download
1 / 22
220 likes | 382 Views
Improving QPE for Dual Polarization Hydrometeors Classified as Dry Snow. Aaron Reynolds WFO Buffalo. Introduction. All NWS radars have dual polarization capability. Dual Pol Expectations: Ability to determine Precip type. More info about intensity Drop/particle size AND

E N D
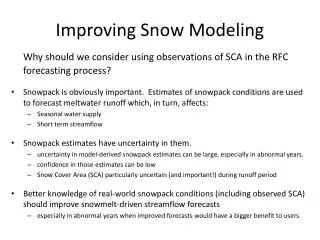
Improving QPE for Dual Polarization Hydrometeors Classified as Dry Snow Aaron Reynolds WFO Buffalo
Introduction All NWS radars have dual polarization capability. Dual Pol Expectations: Ability to determine Precip type. More info about intensity Drop/particle size AND Better Precipitation estimates...for RAIN However...a NON-dual polarization equation is used for snow.
Introduction Freezing level 0.5 degrees • Radar samples “RAIN” • Dual Pol Quantitative Precipitation Estimate (QPE).
Introduction • Radar samples “SNOW” • Pre dual Pol Quantitative Precipitation Estimate (QPE). Freezing level 0.5 degrees • Radar samples “RAIN” • Dual Pol Quantitative Precipitation Estimate (QPE).
The Problem • WFO CLE found: • High QPE bias • Primarily cool season • Above freezing level • Based on DP QPE only – would have led to issuance of flood warnings
Non-Dual Pol QPE The Problem • Before Dual Pol
Non-Dual Pol QPE The Problem 1.27 in, Lyndonville 1.04 in Youngstown 1.11 in, Chili • Before Dual Pol • After Dual Pol • Both show overestimates, but Dual Pol is MUCH worse (higher) • What happened? Overestimation of QPE! Dual Pol QPE 1.04 in, Youngstown 1.27 in, Lyndonville 1.11 in, Chili Huge overestimation of QPE!
Hypothesis Difference of Dual Pol QPE – Legacy QPE Overestimate of QPE when the lowest radar slice samples above the melting layer (Cocks et al. 2012). Radar classified areas above the melting layer as “dry snow’”. Multiplied by 2.8 to derive QPE.
Station Selection 13 gauges identified Requirements: Knowledge of gauge type. Track record. Proper exposure. Record to hundredth of an inch. 10 -100 km range. Mt. Morris, NY
Finding Events. Event requirements: Cold season months of October thru April. Of the 13 gauges identified. Five gauges >= 0.10 for an event.
Data Collection • Dry snow
Data Collection • Dry snow • QPE
Data Collection Dry snow QPE Gauge data.
Data collection Brief periods of missing, or anomalous data were common which required case by case judgment. Data requirements: 90% of the hour had to be “Dry snow”.
Quality control of data Preliminary cases were further screened for accuracy, keeping in mind gauge limitations in certain environments. Data quality requirements: Wind >= 4 m/s 9 gauges w/o shield. Heated tipping bucket issues. Final check of data from cooperative observers and COCORAHs measurements.
Methodology Calculations • A total of 383 hourly cases were identified, from 17 event days. • To calculate the dry snow coefficient we divided the dual-pol QPE by 2.8 to get a raw radar estimate. • This raw value was then compared to the actual gauge measurement, to calculate the ideal coefficient for that event.
Results • For all of the 383 cases, the average dry snow coefficient was 1.19. • This was calculated from the sum of all dual-pol QPE compared to the sum of measured precipitation.
Results QPE from Dual pol Radar compared with measured precipitation for dry snow.
Results by precipitation type. Results
Results by distance from radar. Results
Preliminary Conclusions • Buffalo research supports: -2.8 coefficient is too high. • Errors in the HCC: -Mixed precipitation. -All rain/snow events 1.4 would probably be more representative. • How do we handle this? -Additional research from other locations. (Cleveland, New York, Burlington, State College, Albany and Blacksburg). • Results support Buffalo WFO initial finding! -Cleveland 1.6 -State College 1.2 -Blacksburg 1.4 -Albany 1.9 -New York 1.5
Additional Research Planned • Field testing of RPG build-14 with the new coefficient began this winter at selected offices. Results expected later this year. • Any other comments or questions?