Download

1 / 14
140 likes | 240 Views
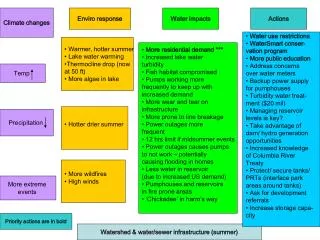
CLIMATE CHANGES-SOME OBSERVATIONS IN CROATIA. MARIJA BERAKOVIĆ, BORIS BERAKOVIĆ AND KSENIJA CESAREC. GENERAL. This paper presents some measurements of climatic elements –TEMPERATURE, PRECIPITATION

E N D
CLIMATE CHANGES-SOME OBSERVATIONS IN CROATIA MARIJA BERAKOVIĆ, BORIS BERAKOVIĆ AND KSENIJA CESAREC
GENERAL • This paper presents some measurements of climatic elements –TEMPERATURE, PRECIPITATION • and surface water-DISCHARGE- in some parts of Croatia, which indicate significant changes in last twenty years. • Two regions are analyzed
Pannonian basin (part of the Drava river basin) Mountain area (Lika and Primorje) • The part of Pannonian Basin-the downstream part of the Drava basin • A mountain area Lika and Primorje near the Adriatic sea
THE DRAVA AREAMETEOROLOGICAL AND HYDROLOGICAL STATIONS IN THE DRAVA RIVER BASIN
Figure 3 Rainfall – monthly variations Figure 4 Hydrograph – Drava river area INTRAANNUAL DISTRIBUTION-MONTHSPRECIPITATION AND DISCHARGE • Precipitation data for three climate stations and two periods: 1961-1990 1991-2003 The total yearly amount is the some for both periods The intraanual distribution is changed in last twenty years Less precipitation in the first and second quarter and more in the last quarter of the year. The same conclusion can be done for discharges presented on three hydrological stations located at the Drava river tributaries
INTRAANNUAL DISTRIBUTION-QUARTERSPRECIPITATION AND DISCHARGE
Figure 3 Rainfall – monthly variations Figure 4 Hydrograph – Drava river area INTRAANNUAL DISTRIBUTION-MONTHSPRECIPITATION AND DISCHARGE • Precipitation data for three climate stations and two periods: 1961-1990 1991-2003 The total yearly amount is the some for both periods The intraanual distribution is changed in last twenty years Less precipitation in the first and second quarter and more in the last quarter of the year. The same conclusion can be done for discharges presented on three hydrological stations located at the Drava river tributaries
THE LIKA AND PRIMORJE AREAMETEOROLOGICAL AND HYDROLOGICAL STATIONS IN MOUNTAIN REGIONS
Figure 5 Rainfall – monthly variations Figure 6 Hydrograph – Lika area INTRAANNUAL DISTRIBUTION-MONTHSPRECIPITATION AND DISCHARGE • Precipitation data for three climate stations and two periods: 1961-1990 1991-2005 The total yearly amount is the some for both periods The intraanual distribution is changed in last twenty years Less precipitation in the first and second quarter and more in the last quarter of the year The same conclusion can be done for discharges presented on three hydrological stations loceted at the main rivers in that area
INTRAANNUAL DISTRIBUTION-QUARTERSPRECIPITATION AND DISCHARGE
Figure 5 Rainfall – monthly variations Figure 6 Hydrograph – Lika area INTRAANNUAL DISTRIBUTION-MONTHSPRECIPITATION AND DISCHARGE • Precipitation data for three climate stations and two periods: 1961-1990 1991-2005 The total yearly amount is the some for both periods The intraanual distribution is changed in last twenty years Less precipitation in the first quarter and more in the last quarter of the year The same conclusion can be done for discharges presented on three hydrological stations loceted at the main rivers in that area
BOTH AREASMEAN ANNUAL AIR TEMPERATURE The air temperature changes are occurred since 1987. The average yearly temperature increased by 1,16°C in the Drava area and 0,87°C in mountain area The highest value of yearly mean on all stations occurred in the year 2000 The highest value of maximum monthly mean in the last 45 year occurred in May,June and August 2003. Figure 7 Mean annual air temperature - Djurdjevac Figure 8 Mean annual air temperature – Donji Miholjac Figure 9 Mean annual air temperature - Gospić
CONCLUDING DISCUSSION The conducted examinations indicate a presence of change within yearly precipitation and watercourse in Croatia, especially in the Drava river Basin, while there is no change in the total yearly water quantity. The observation of the mean yearly temperatures indicates an increase in the last twenty years. Noticed changes influence the agriculture and water resource management. The Lika area is rich in precipitation, but there yearly schedule is not favourable because of the redistribution of precipitation and it becomes more unfavourable. The average yearly temperature is systematically increasing, but also the absolute low extremes get to be even lower. The examination of precipitation and air temperature, along with the river discharge, indicate that is necessary to change some parts of the water management and also the systematic, long term and quality meteorological and hydrological observations are needed including the advise of the World Meteorological Organisation.
THANK YOU FOR YOUR ATTENTION THE RIVER GACKA VALLEY