Download
1 / 4
40 likes | 252 Views
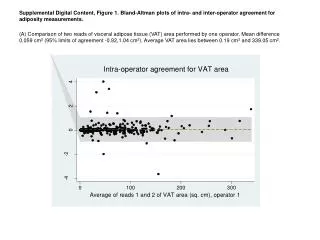
Supplemental Digital Content, Figure 1 . Bland-Altman plots of intra- and inter-operator agreement for adiposity measurements . .

E N D
Supplemental Digital Content, Figure 1. Bland-Altman plots of intra- and inter-operator agreement for adiposity measurements. (A) Comparison of two reads of visceral adipose tissue (VAT) area performed by one operator. Mean difference 0.059 cm2 (95% limits of agreement -0.92,1.04 cm2). Average VAT area lies between 0.19 cm2 and 339.05 cm2.
Supplemental Digital Content, Figure 1 (continued). Bland-Altman plots of intra- and inter-operator agreement for adiposity measurements. (B) Comparison of reads of visceral adipose tissue (VAT) area performed by two different operators. Mean difference 0.14 cm2 (95% limits of agreement -0.93, 1.22 cm2). Average VAT area lies between 0.19 cm2 and 338.80 cm2.
Supplemental Digital Content, Figure 1 (continued). Bland-Altman plots of intra- and inter-operator agreement for adiposity measurements. (C) Comparison of two reads of subcutaneous adipose tissue (SAT) area performed by one operator. Mean difference -0.059 cm2 (95% limits of agreement -1.04, 0.92 cm2). Average SAT area lies between 0.08 cm2 and 861.84 cm2.
Supplemental Digital Content, Figure 1 (continued). Bland-Altman plots of intra- and inter-operator agreement for adiposity measurements. (D) Comparison of reads of subcutaneous adipose tissue (SAT) area performed by two different operators. Mean difference -0.11 cm2 (95% limits of agreement -1.90, 1.68 cm2). Average SAT area lies between 0.08 cm2 and 863.10 cm2.