Download
1 / 20
210 likes | 289 Views
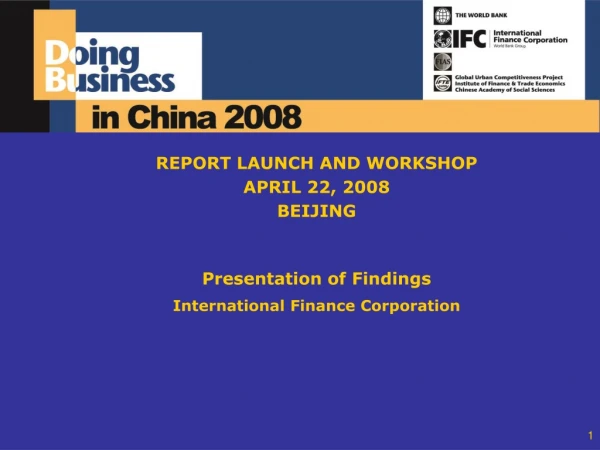
Presentation of report findings. Nairobi – June 26, 2012. Mierta Capaul Program Manager Global Indicators and Analysis Department World Bank. 2. What does Doing Business measure?. Doing Business indicators:

E N D
Presentation of report findings Nairobi – June 26, 2012 Mierta Capaul Program Manager Global Indicators and Analysis Department World Bank 2
What does Doing Business measure? • Doing Business indicators: • Focus on regulations relevant to the life cycle of a small to medium-sized domestic business. • Are built on standardized case scenarios. • Are measured for the most populous city in each country. • Are focused on the formal sector. • DO NOT measure all aspects of the business environment such as: macroeconomic stability, corruption, level of labor skills, proximity to markets, or regulation specific to foreign investment or financial markets. 3
Doing Business indicators – 11 areas of business regulation (10 included in the ranking) Entry Property rights Investor protection Access to credit Administrative burden Flexibility in hiring Recovery rate Reallocation of assets 4
1 Diagnostic Tool 2 Reform Instrument 3 M&E Device Subnational Doing Business: How does Kenya benefit from it? • Allows locations to compete locally and globally • Promotes peer to peer learning • Initiates a reform process by engaging local governments and reforms stakeholders • Goes beyond largest city to create baseline and capture local difference in regulations • Gives specific locations an opportunity to tell their story • Pinpoints bottlenecks and provides good practice examples • Measures progress over time through repeated benchmarking • Creates an incentive to maintain the reform effort even when governments change 5
Doing Business in Kenya in 2012, second in the subnational series,benchmarks 13 locations • Doing Business in Kenya 2010 • Created micro-level data for 10 cities in addition to Nairobi: Eldoret, Garissa, Isiolo, Kilifi, Kisumu, Malaba, Mombasa, Narok, Nyeri, and Thika • Doing Business in Kenya 2012 • Adds 2 new cities (Kakamega and Nakuru) • Updates benchmarks for cities previously measured • Tracks business reforms in all cities • Data is current as of March 2012 • Both reports cover 4 indicators • Starting a business • Dealing with construction permits • Registering property • Enforcing contracts 6
What are the key findings? • Overall, it is easier to start a business, deal with construction permits, register property and enforce a contract in Malaba, Narok and Thika. • Business reforms implemented over the past three years have made it easier for local entrepreneurs to start and operate a business throughout Kenya. • Challenges remain – overall starting a business is burdensome and construction permitting is more expensive due to costly environmental expert assessments. 7
No single city outperforms the others in more than one area 8
It is easier to do business in all 13 cities now than 3 years ago Doing Business reforms making it easier do to business Doing Business reforms making it more difficult to do business 9
Business entry reforms resulted in time and cost savings for local entrepreneurs 81.2 DB Kenya 2010 average 67 48.4 DB Kenya 2012 average 45 Sub-Saharan average 2012 43.4 37 12 10 8 10
Time differences to start a business across locations reveal potential for future improvement DB Kenya 2012 average (45 days) DB Kenya 2010 average (67 days) 11
Obtaining building plan approvals is 4 times faster in Malaba than in Nakuru Time (days) 12
Variations in time to register property point to opportunities for local improvements 14
Isiolo remains the only city charging a local property transfer tax Isiolo reduced the cost to register property • Isiolo cut the local transfer tax by 15 percentage points (from 20% to 5%) reducing overall costs by 62% • But Isiolo remains the only city charging a local property transfer tax, in addition to the nationally mandated stamp duty of 4% 15
Enforcing a contract in Kenya is easier than in the average Sub-Saharan Africa city 16
A city adopting all Kenyan best practices would rank 14 places higher than Kenya’s* current rank in Doing Business * Represented by Nairobi. Source: Doing Business database 17
Good business regulations and governance In countries where business regulation is efficient and information on documentation requirements and fee schedules is easily accessible, the perception of corruption is lower 18
Kenya Investment Climate Program (KICP): 2008-2012 • Active since 2007: • In 2007 the WBG Investment Climate Advisory Services responded to a GoK request to support reform of the country’s investment climate • Components of KICP: • Regulatory reform: Licensing Reform, Regulatory Reform Strategy, E-registry and automation, Inspection and Enforcement Reform, Regulatory Impact Analysis, Doing Business, Subnational Doing Business and PPD • Investment generation • Trade logistics • Achievements of KICP: • Kenya named a top reformer in Doing Business 2008 • Business licensing reforms with 60% licenses either abolished or streamlined leading to private sector cost savings • e-Registry 19
THANK YOU www.doingbusiness.org/Kenya