Download
1 / 16
160 likes | 388 Views
Cody Hyman. Power Grid Load Leveling. Division of Power Generation. The Base Load Power Plants Always active and feeding the grid Mostly Coal and Nuclear Intermediate and Peaking Power Plants Activated when power demand increases Includes smaller fossil fuel plants and hydroelectricity

E N D
Cody Hyman Power Grid Load Leveling
Division of Power Generation • The Base Load Power Plants • Always active and feeding the grid • Mostly Coal and Nuclear • Intermediate and Peaking Power Plants • Activated when power demand increases • Includes smaller fossil fuel plants and hydroelectricity • Supplemented by forms of Alternative Energy • Source: http://www.opc.com/PoweringGeorgia/TypesofPowerPlants/index.htm
Basic Load Principle • The greater the demand for power, the more current the power plants must provide • Power companies need to provide a relatively constant AC voltage and frequency to customers • The power transmission and distribution grid of a developed nation like the US is an incredibly complex and constantly changing circuit
The Day and Night Cycle • Large Fluctuation Between Day and Night Power Demand (lowest demand may be around 60% of peak demand) • Grid must quickly compensate for changes in demand • Additionally, demand varies by other factors including the local climate and season
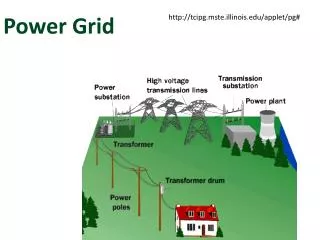
Demand Throughout the Day Image taken from California ISO state grid data for 13 October 2009 Current grid data can be found at http://www.caiso.com/outlook/outlook.html
Effects of Unbalanced Generation and Load • If demand is too great, outages occur • Dropouts, brownouts, and blackouts • Rolling blackouts are created intentionally to keep the grid partially up while demand is too great for the grid to support • Most surplus energy, if there is any, is lost
How the Load is Leveled • Organizations managing the grid predict load curves • ex: the California ISO • Number of connected generators is varied • Spinning reserves and peaking plants supply extra power during peak demand • Stored energy is sometimes fed into the grid
Storing Surplus Energy • Some energy can be stored for use during peak hours • Only a small fraction is stored currently due to the expense of storing energy • Intermittent power sources such as wind and solar may suddenly stop generating power, causing a large droop in the grid • Storage methods include • Batteries (Very efficient, but expensive) • Pumping water for hydroelectricity • Gas Compression1 • Flywheels (Steadying Voltage and UPSs) • HowStuffWorks. Grid Energy Storage <http://science.howstuffworks.com/earth/green-technology/sustainable/community/grid-energy-storage.htm >.1-http://www.mercurynews.com/business/ci_13210674?nclick_check=1
The Potential Impact of EVs • Great increase in total grid demand as more electric vehicles are put on the road • Off-Peak Night Charging to fill “valleys” in the demand curve • The Pacific Northwest National Lab estimate: approximately 70% of an EV based American road transportation system could be charged on current generation capacity • Would decrease the amount of necessary grid expansion • PHEV Projections obtained from PNWNL: <http://www1.eere.energy.gov/vehiclesandfuels/avta/pdfs/phev/pratt_phev_workshop.pdf>
A Rough Estimate of EV Energy Requirements • PNWNL estimates the following energy requirements for hybrid electric vehicles with an average generator to battery efficiency of around 68-70% (includes transmission and distribution losses as well as charger and battery inefficiencies) • Compact Cars 0.26kWh/mi • Mid-Sized Cars 0.30kWh/mi • Mid-Size SUVs/Vans 0.38kWh/mi • Full Size SUVs 0.46 kWh/mi • The U.S. Bureau of Transportation Statistics estimates that in the U.S. During 2006, there were 1.683x10¹²mi driven in passenger cars and 1.089x10¹²mi driven in other 2-axle 4 wheeled vehicles (vans and SUVs) Per Mile Energy Cost:< http://www1.eere.energy.gov/vehiclesandfuels/avta/pdfs/phev/pratt_phev_workshop.pdf>BTS Mileage Data:< http://www.bts.gov/publications/national_transportation_statistics/html/table_01_32.html>
A Rough Estimate of EV Energy Requirements • A rough assumption based on my own calculations of the data puts annual passenger car/SUV demand at 900-1000TWh (1PWh) • Peak Generation Output of US Generators is approx 1.1TW, assuming maybe 900GW are in operation at all times, around 7900TWh could be generated annually. • The EIA also estimates the addition of around 20GW of generation capacity annually • Current demand averages around 640-780GW • In reality only some regions can currently cope with a heavy EV demand (Midwest has the capacity to currently support a full conversion to EVs, the West Coast does not) • Power Generation Data from U.S. Energy Information Administration (EIA)
Vehicle-To-Grid • Potential to sell electricity from an EV back to the grid during peak demand hours • A single EV can likely supply around 10kW • Also could be used as a source of emergency power in the event of a blackout. A nation of electric cars could potentially power the grid for up to 5 hours Image Source: University of Delaware<http://www.udel.edu/V2G/page2/page9/files/pasted-graphic-1.jpg>
A Smarter Grid • A growing number of regions across the world are implementing modern technology to power distribution and metering • Smart meters can be used to provide time-specific electricity rates and cause non-essential power usage to be rescheduled to non-peak hours • Pricing changes or appliance-specific lockouts will influence • Example: Increased cost of running large appliances during peak load hours • Smart Meters will likely be essential to the implementation of a national EV fleet and V2G technology
Smart Meters Source B.B.S. Electronics <http://www.bbsgroup.com.sg/images/AMRsolution.jpg>
Implementation of Smart Metering • Some regions and nations are actively installing smart meters • Ontario, Canada will have converted entirely over to smart meters by 2010 • California and Texas also have large scale implementation of smart meters • Also used extensively in the UK and Australia Image Source: https://www.horizonutilities.net/HHSC/assets/images/SmartMeter.jpg
Sources • Types of Power Plants, Oglethorpe Power <http://www.opc.com/PoweringGeorgia/TypesofPowerPlants/index.htm> • Current Demand Outlook, California ISO <http://www.caiso.com/outlook/outlook.html> • Blackouts, Virginia Department of Emergency Management <http://www.vaemergency.com/threats/blackout/> • Pratt, et. al., Potential Impacts of High Penetration of Plug-in Hybrid Vehciles on the U.S. Power Grid, Pacific Northwest National Laboratory, June 2007, <http://www1.eere.energy.gov/vehiclesandfuels/avta/pdfs/phev/pratt_phev_workshop.pdf> • U.S. Bureau of Transportation Statistics 2006 Vehicle Milage Data <http://www.bts.gov/publications/national_transportation_statistics/html/table_01_32.html> • Vehicle-To-Grid Technology, University of Delaware <http://www.udel.edu/V2G/> • Vehicle-To-Grid Technology Diagram, University of Delaware <Source: University of Delaware<http://www.udel.edu/V2G/page2/page9/files/pasted-graphic-1.jpg> • Energy Information Administration Data <http://www.eia.doe.gov/>