Download
1 / 7
80 likes | 290 Views
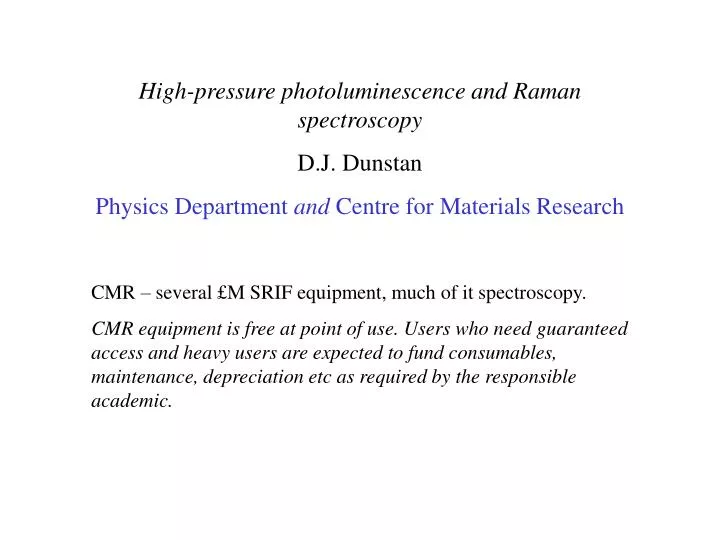
High-pressure photoluminescence and Raman spectroscopy D.J. Dunstan Physics Department and Centre for Materials Research. CMR – several £M SRIF equipment, much of it spectroscopy.

E N D
High-pressure photoluminescence and Raman spectroscopy D.J. Dunstan Physics Department and Centre for Materials Research CMR – several £M SRIF equipment, much of it spectroscopy. CMR equipment is free at point of use. Users who need guaranteed access and heavy users are expected to fund consumables, maintenance, depreciation etc as required by the responsible academic.
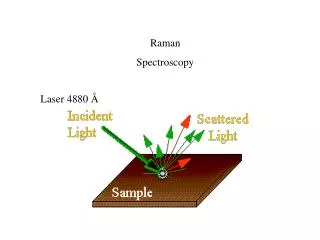
Renishaw Raman Microscope • 632nm He-Ne • Si CCD • Raman • Photoluminescence • Absorption High Pressure using diamond-anvil cells, controllable from 1 to 500 kbar.
Diamond-anvil cell Standard configuration: All spectroscopies, 10-500 kbar Zen configuration: PL and Raman, 1-25kbar Thick gasket configuration: All spectroscopies, 1-25 kbar (New)
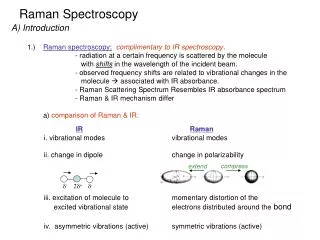
Raman of chloroform liquid under high pressure Diamond-anvil cell in Zen configuration. FIG. 3. Frequency of the antisymmetric C–Cl bending (a)and symmetric C–Cl bending (b)modes as a function of pressure, calculated in the MD (open triangles) and measured experimentally (solid squares). The solid lines represent quadratic fits to the liquid data only. In (b)a fit has also been performed on the experimental data. MD values are shifted vertically by 54 cm−1 aand 73 cm−1 b.
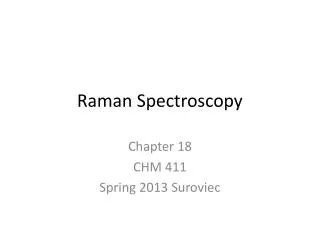
Denaturation of a pigment-protein complex using unpolarised absorption Figure 3. Temperature dependence of the absorption spectrum of the RC in detergent micelles. Several selected temperature are presented and the colour code is described in the Figure insert. The arrows indicated absorption increase and decrease as a function of temperature at selected wavelengths. Figure courtesy of Dr Stephano Santabarbara, SBCS. I expect this to be very straightforward to repeat as a function of pressure in the diamond-anvil cell (Thick gasket configuration).
Hydraulic 7kbar optical pressure cell in SBCS • Takes a cuvette a few mm across • Sits in a standard UV-VIS-IR spectrophotometer • Absorption spectroscopy certainly . . . • . . . and circular dichroism?
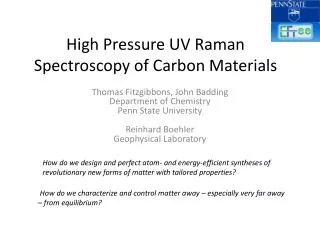
Effect of pressure of protein stability as monitored by CD From Brindley, Brocklehurst, Pickersgill, Partridge, Dunstan and Warren