Download

1 / 47
470 likes | 599 Views
Microarray Basics. Part 1: Choosing a platform, setting up, data preprocessing. Experimental design. What type of microarray What overall design strategy How many replicates. Type of Microarray. One colour. Two colour. Short oligo. cDNA. Long oligo. Genome wide. Custom.

E N D
Microarray Basics Part 1: Choosing a platform, setting up, data preprocessing
Experimental design • What type of microarray • What overall design strategy • How many replicates
Type of Microarray One colour Two colour Short oligo cDNA Long oligo Genome wide Custom availability, cost, represented genes, need, perceived accuracy/reproducibility
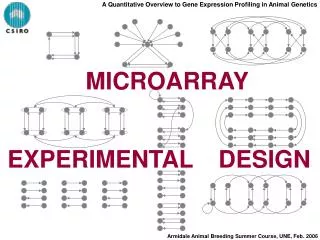
Cy3 Cy3 reference reference x40 healthy healthy healthy healthy healthy healthy x20 Cy5 Cy5 disease disease disease disease disease disease Cy3 x10 x10 Cy5 Cy3 x40 Cy5 Experimental Design Strategies
How many replicates? True situation Not diff expressed Diff expressed correct Type 2 error NS (power) Your call Type 1 error correct S (confidence) Technical replicates do NOT count as different samples in the power calculation
Power analysis requires decisions about: Difference in mean that you are trying to detect The std dev of the population variability Power you are trying to achieve Significance level that you are trying to achieve Experimental design You have a 10,000 gene chip, and want to identify 95% of the genes that are 2 fold up or down regulated in samples following treatment. You will tolerate 1 false positive call out of the 10,000 genes tested. The coefficient of variability in your population is ~ 50%. You are doing a paired analysis. One can conclude that you will need 22 patients
Technical replicates • Most publications recommend at least 3 if that is possible • These are considered to be replicates at the level of the experimental platform • Beware of doing 2 now and hoping to add one more later • In downstream analysis, generally suggested to use the average of technical replicates- these are not different samples for analysis
RNA required to get started • Source of both experimental and reference RNA • Will need about 10-20ug of total RNA from each source for each experiment or chip • This RNA needs to be of high quality • How do you check quality?
Common sources of RNA Cultured animal cells: generally easy to disrupt and get large amounts of high quality RNA Animal tissues: some require harsh disruption treatments (such as soft tissues like kidney or liver) and some may require addition treatments (such as fatty tissues or fibrous tissues that may require more stringent lysis) Blood: may be influence by anticoagulant in collection system, and also seems to contain enzyme inhibitors Plant material: some metabolites make purification difficult- extractions may also be highly viscous Bacteria: may want to consider stabilization
Checking RNA quality • Conventional methods include agarose gel electrophoresis to look for evidence of degradation • Spectrophotometric readings to give an idea of purity • Bioanalyzer to provide scan- integrity and quantity measurements
Provides an RIN Provides a [ ] Requires 1 µl of ~50ng/µl stock
RNA amplification • When quantity of RNA is limited, may have to consider amplification • Several strategies, but need to decide up front if you want sense or antisense amplified material
What do you get back after an experiment? • TIFF images- one image for each fluor used in the experiment- same chip scanned twice (or more times if multiple scans were done to compensate for intensity) • Spreadsheet of quantitated data
TIFF images • Generally named as: bar code_fluor_PMT setting_laser setting • These settings will not necessarily be the same for your two scans from the same chip- they are manipulated to try to produce scans of even intensity from the two fluors • The final image should have only a few white spots over the whole array- these represent saturated spots
How can you tell anything about the quality of your data? • Easiest way to start is to look at your TIFF images • Look for blank areas on the slide • Look for areas where one fluor consistently is brighter than the other • Look for gradients of intensity • Differentiate between artifacts introduced by slide quality and those by RNA quality and those by experimental procedure
Slide issues- printing • Presence of donuts • Smeared spots • Scratches on surface of slide • Non circular spots • Spots off the grid • No signals in areas • Consistent problems with the same area of each subarray
RNA quality issues • General low intensity • Consistent problems with one sample, regardless of fluor used • High level of background- grainy over entire slide
Experimental issues • One fluor consistently not giving good signal regardless of RNA sample labelled • High areas of local background not covering entire slide • Obvious intensity gradients • Bubbles over surface of chip
After looking at your images you should have a sense of whether or not these data are likely to be clean and high enough quality to warrant proceeding • If not you need to try to determine where the problem originates
Image processing • Choice of methods for quantitating image • Fixed circle • Good for arrays with regular sizes of spots • Variable circle • Better for arrays with irregular sizes • Histogram • Best for arrays with irregular sizes and shapes
Data quantitation • The images are quantitated, generating a lengthy spreadsheet • This is done in the facility using QuantArray, but can be done using other freeware (Scanalzye) or commercial software • The output can generally be opened in Excel for first pass manipulation of data
QuantArray output • QA generates a series of columns that many people find confusing • In general, it provides the data in two ways on a single sheet- the first method is showing one channel as a proportion of the other, the second method provides absolute pixel counts for each channel
Information about the experiment Data presented as ratios Raw quantitated data
Locator and identifier columns • A: unique number assigned to that spot • B: Row of subgrid • C: Column of subgrid • D: Row of spot within subgrid • E: Column of spot within subgrid • F: Gene identification • G: x coordinate of each spot • H: y coordinate of each spot
Spot Values • I/U: intensity of signal in ch1/ch2 • J/V : intensity of background in ch1/ch2 • K/W: std dev of intensity of signal in ch1/ch2 • L/X: std dev of background of signal in ch 1/ch2
Quality control measurements • M/Y spot diameter • N/Z spot area • O/AA spot footprint • P/AB spot circularity • Q/AC spot uniformity • R/AD background uniformity • S/AE signal to noise ratio
Data Cleaning Are there flagged spots? -may see flags in last column- these are added by user during quantitation Are there areas of the images that you just wouldn’t trust? Are there saturated spots? Have the option of removing, recalculating, ignoring , flagging or resetting the results of these spots so that they don’t interfere with downstream analysis At this stage, may also want to background subtract the raw intensities
On chip controls and how they behave • Blank spots: generally 3XSSC (print buffer) • Expect no signal- can use the average or median intensity of these spots as the lower cutoff for what represents a real signal • However not all empty spots are the same on some chips • Possibility that there is carryover from non-empty spots printed with the same pin
On chip controls • Multiple spots of the same gene • In general if it is exactly the same sequence, can assess the variability of these spots to assess artifacts of geography on the chip • If it is not the same sequence, less straightforward
On chip controls • Housekeeping genes: if you can identify a set of genes that should remain at constant expression, can use these to standardize the two channels • to correctly identify such genes is difficult • May also have exogenous controls that can be added, but must identify these prior to hybridizing the slides
Log transformation of data Most data bunched in lower left corner Variability increases with intensity Data are spread more evenly Variability is more even
Within array normalization In two colour arrays, are measuring two different samples, labelled in two different reactions with two different fluors and measured using two different lasers at two different wavelengths In addition, dealing with the distribution of spots across a relatively large surface Need to try to eliminate some of these potential sources of variation so that the variation that is left is more likely to be due to biological effects
Dye Bias • The two dyes incorporate differently into DNA of different abundance • The two dyes may have different emission responses to the laser at different abundances • The two dye emissions may be measured by the PMT differently at different intensities • The intensities of the dyes may vary over the surface of the slide, but not in synch, as the focus of each laser is separate
Correcting for dye bias • Global normalization using median or mean • Linear regression of Cy3 against Cy5 • Linear regression of the log ratio against the average intensity (MA plots) • Non linear regression of the log ratio against the average intensity (loess) **assumption that most genes are not differentially expressed**
Simple global normalization to try to fit the data Slope does not equal 1 means one channel responds more at higher intensity Non zero intercept means one channel is consistently brighter Non straight line means non linearity in intensity responses of two channels
Linear regression of Cy3 against Cy5
MA plots Regressing one channel against the other has the disadvantage of treating the two sets of signals separately Also suggested that the human eye has a harder time seeing deviations from a diagonal line than a horizontal line MA plots get around both these issues Basically a rotation and rescaling of the data A= (log2R + log2G)/2 X axis M= log2R-log2G Y axis
Scatterplot of intensities MA plot of same data
Non linear normalization Normalization that takes into account intensity effects Lowess or loess is the locally weighted polynomial regression User defines the size of bins used to calculate the best fit line Taken from Stekal (2003) Microarray Bioinformatics
Adjusted values for the x axis (average intensity for each feature) calculated using the loess regression Should now see the data centred around 0 and straight across the horizontal axis
Spatial defects over the slide • In some cases, you may notice a spatial bias of the two channels • May be a result of the slide not lying completely flat in the scanner • This will not be corrected by the methods discussed before
Regressions for spatial bias • Carry out normal loess regression but treat each subgrid as an entire array (block by block loess) • Corrects best for artifacts introduced by the pins, as opposed to artifacts of regions of the slide • Because each subgrid has relatively few spots, risk having a subgrid where a substantial proportion of spots are really differentially expressed- you will lose data if you apply a loess regression to that block • May also perform a 2-D loess- plot log ratio for each feature against its x and y coordinates and perform regression
Acknowledgements • Perseus Missirlis • Natasha Gallo • Jim Gore • Jennifer Kreiger • Scott Davey