Download
1 / 22
220 likes | 422 Views
Using the Problem Solving/Response to Intervention (PS/RtI) Model for Challenging Behaviors . True/False. PS/RtI for behavior begins with the school wide behavior system. _______ Hypotheses are not useful in the behavior RtI process. ______

E N D
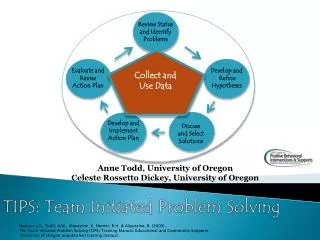
Using the Problem Solving/Response to Intervention (PS/RtI) Model for Challenging Behaviors
True/False • PS/RtI for behavior begins with the school wide behavior system. _______ • Hypotheses are not useful in the behavior RtI process. ______ • Research reports that the PS/RtI process is effective for changing behavior in middle schools.______ • An example of a Tier 2 behavior intervention is small group counseling/social skills training.______ • RtI behavior interventions should not be done in the classroom. ______
Purpose of Meeting • Review School Behavior Data • Review PS/RtI and The Three Tiers of Behavior • Problem Solve School Data
School –Based Behavior Data • Event Count by Month • Event Count by Location • Incident Count by Description • Action Count by Description See next slide to make predictions.
Office Discipline WorksheetMake predictions in the following categories. • Where do most of the behavior incidents occur (i.e. class, cafeteria, etc.)? • What are the most common ODR incidents (i.e. inappropriate behavior, non-compliance, dress code, etc.)? • What are some consequences for ODR’s (i.e. call home, suspension, etc.)? • During which months do most ODR’s occur? • How much time typically is devoted to the ODR incident process? DISPLAY CHARTS
Time Lost With ODR (Office Discipline Referral) PBS (Positive Behavior Support) research documents that for every ODR: • 15 minutes of teacher time is lost. • 30 minutes of administrator time is lost. • 45 minutes of student instructional time is lost. 90 minutes of time is lost with each ODR.
Step 1 – Problem Identification: What is the problem? To identify a problem, begin with three pieces of data • Expected level of performance • Student level of performance • Peer level of performance
Form hypotheses about why the student (or group of students) is not demonstrating the expected behavior. Validate hypotheses through data collection. Step 2 - Problem Analysis: Why is it occurring?
Hypothesis Example In reviewing and analyzing their Office Discipline Referrals (ODR’s), XYZ Middle School determined that 150 out of 200 referrals were for dress code violations. If district dress code policy was reviewed with all students weekly and appropriate dress positively reinforced, there would be a decrease in ODR’s for dress code violations.
Step 3 – Intervention Design: What are we going to do? • Match intervention type and intensity to student(s), setting, problem. • Interventions must focus on teaching replacement behavior. • Select evidence-based interventions that match context of school/classroom culture. • Provide support for implementation. • Coaching • Evaluation of implementation integrity
Goal Step 4 – Progress Monitoring: Is it working? • Making instructional / intervention decisions based on review and analysis of student data • Progress monitoring always includes graphing Classroom Intervention I Classroom Intervention 2 11
Tier III of Behavioral Intervention/Support Tier III: Assessments FBA Progress Monitoring Graph/RtI (Eligibility Assessment) Tier III: Individualized Interventions Behavior Intervention Plan Individual CounselingSelf-Monitoring 1 - 5% 1-5% Tier II Assessments Behavioral Observations Intervention Data Gap Analysis Tier IITargeted Interventions Targeted Group Interventions Social Skills Training Small Groups 10-15% 80 - 90% Tier I Assessments Discipline Data (ODR) Benchmark Assessment Universal Screening Tier I Core Interventions School-wide Discipline Positive Behavior Supports Whole-class Interventions 10 - 15% 80 - 90% 12
Tier I • Key Questions • How effective are school-wide programs and positive behavior supports? • How well are Tier I interventions implemented? • Data Analysis - Sources for data gathering • Discipline data - Office discipline referrals (ODR) • Disaggregated data & school climate surveys • PBS (Positive Behavior Support) Benchmark Assessment • Universal screening (mental health & behavior)
Tier 1: Universal Interventions • School wide rules and expectations • Positive reinforcement system • School Wide Social Skills Program • School Wide Problem Solving Skills
Tier 2 • Key Questions • Which students need targeted interventions? • How effective are targeted interventions? • How are targeted interventions linked to Tier I? • How well are Tier II interventions implemented? • Data Analysis - Progress monitor with • Individual student data on intensity of behavior (frequency, duration) • Behavior Progress Report Form
At-risk students who may need more support These students represent less than 25% of school enrollment They account for over 50% of behavioral incidents They consume significant amounts of time and resources Targeted Group Interventions 5% 15% 80% of Students
Tier 2: Targeted Small Group Interventions • Small group counseling/ social skills training • Check In-Check Out Systems • Behavior Contracts • Point Cards (Continue all Tier 1 interventions)
Tier 3 • Key Questions • What specific interventions are needed at Tier III? Increased intensity of Tier II intervention? Different, individualized intervention? • How well are Tier III interventions implemented? • What is the student’s response to evidence-based interventions? • Data Analysis • Functional Behavior Assessment (FBA) • Graph of Response to Intervention data
Tier 3: Individual Intensive Interventions • Individual counseling • Function-based interventions • Behavior contracts • Prevent-Teach-Reinforce
Analyzing the data, how well do your school wide expectations work? • How well do the expectations work in the • Classrooms • Common areas • Cafeteria • Bus • Other • Identify areas where expectations are not working and develop hypotheses to determine why expectations are not working. Examples: How are expectations communicated? How are expectations taught? Are expectations consistently reinforced? • Based on your hypothesis statement, what are some interventions that would reduce the behavior problems in specific areas?
True/False • PS/RtI for behavior begins with the school wide behavior system. • Hypotheses are not useful in the behavior RtI process. • Research reports that the PS/RtI process is effective for changing behavior in middle schools. • An example of a Tier 2 behavior intervention is small group counseling/social skills training. • RtI behavior interventions should not be done in the classroom.
Resources Dr. Linda Fowler RtI Resource Specialist Professional Development 941-751-6550 ext. 2218 Jessica Clark Kearbey Secretary II Professional Development 941-751-6550 ext. 2293 Kathy Haugan RtI Resource Specialist Professional Development 941-751-6550 ext. 2256 Karen Mills Behavior Specialist ESE Department 941-751-6550 ext. 2239