Download
1 / 31
310 likes | 476 Views
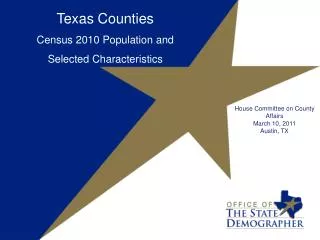
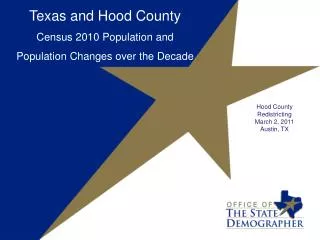
Texas Census 2010 Population and Population Changes over the Decade. All Texas CPD Grantee Meeting April 20, 2011 Round Rock, TX. Growing States, 2000-2010. 15.7% of numerical change in U.S. . Source: U.S. Census Bureau. 2000 and 2010 Census Count. . Total Population by County, 2010.

E N D
Texas Census 2010 Population and Population Changes over the Decade All Texas CPD Grantee Meeting April 20, 2011 Round Rock, TX
Growing States, 2000-2010 15.7% of numerical change in U.S. Source: U.S. Census Bureau. 2000 and 2010 Census Count.
Total Population by County, 2010 Source: U.S. Census Bureau 2010 Census Counts
Change of the Total Population by County, 2000 to 2010 Source: U.S. Census Bureau 2000 and 2010 Census Counts
Percent Change of Total Population in Texas Counties, 2000-2010 Population increase for Texas was 20.6% during this period Source: U.S. Census Bureau. 2000 and 2010 Census Counts
Total Population and Components of Population Change in Texas, 1950-2009
Estimated Number and Percent of Migrants to Texas between 2000 and 2009 by Race and Ethnicity 52% of all migrants were international 67% of all migrants Sources: Percentages of domestic and international migrants by race and ethnicity derived from the 2006-2008 American Community Survey. Total numbers of domestic and international migrants between 2000-2009 are from Table 4. Cumulative Estimates of the Components of Resident Population Change for the United States, Regions, States, and Puerto Rico: April 1, 2000 to July 1, 2009, U.S. Census Bureau
States with Largest Unauthorized Immigrant Populations, 2010 Sources: Pew Hispanic Center estimates based on residual methodology applied to March Supplements to the Current Population Survey (February 1, 2011)
Texas Racial and Ethnic Composition, • 2000 and 2010 Source: U.S. Census Bureau. 2000 and 2010 Census count
Change in the Racial and Ethnic Composition, Texas, 2000-2010 Source: Census 2000 and Census 2010 PL94-171 Redistricting Data for Texas
Percent of the Population that is non-Hispanic Anglo and Hispanic by County, 2010 Hispanic non-Hispanic Anglo Source: U.S. Census Bureau 2010 Census Counts
Non-Hispanic Anglo Population by County, 2010 Source: U.S. Census Bureau 2010 Census Counts
Hispanic Population by County, 2010 Source: U.S. Census Bureau 2010 Census Counts
Non-Hispanic Black Population by County, 2010 Source: U.S. Census Bureau 2010 Census Counts
Non-Hispanic Asian Population by County, 2010 250,000 Source: U.S. Census Bureau 2010 Census Counts
Projected Population Growth in Texas, 2000-2040 Year Source: Texas State Data Center 2008 Population Projections
Projected Racial and Ethnic Percent, Texas, 2000-2040 Source: Texas State Data Center 2008 Population Projections , 2000-2007 Migration Scenario
Median Housing Unit Age by County, 2005-2009 Source: U.S. Census Bureau, American Community Survey, 5-Year Sample 2005-2009
Percent of Housing Units that are Vacant, 2005-2009 Source: U.S. Census Bureau, American Community Survey, 5-Year Sample 2005-2009
Percent of the population 5 and over who speak Spanish at home, 2005-2009 Source: U.S. Census Bureau, American Community Survey, 5-Year Sample 2005-2009
Percent of Households that are Linguistically Isolated, by County, 2005-2009 Source: U.S. Census Bureau, American Community Survey, 5-Year Sample 2005-2009
Median Household Income by County, 2005-2009 Source: U.S. Census Bureau, 2005-2009 American Community Survey
Percent of Children Less than 18 Years of Age in Poverty During the Past 12 Months by County, 2005-2009 Source: U.S. Census Bureau, 2005-2009 American Community Survey
Educational Attainment in Texas, 2009 Source: Texas S1501. Educational Attainment 2009 American Community Survey 1-year Estimates, US Census Bureau.
Percent of population aged 25 years and older with high school or equivalent degree or higher 2005-2009 Source: U.S. Census Bureau, American Community Survey, 5-Year Sample 2005-2009
Percent of population aged 25 years and older with Bachelors degree or higher. 2005-2009 Source: U.S. Census Bureau, American Community Survey, 5-Year Sample 2005-2009
Texas economy 2nd largest in the U.S. 15th largest in the world based on GDP Source: CNBC.com
Contact Office: (512) 463-8390 or (210) 458-6530 Email: Lloyd.Potter@osd.state.tx.us Internet: http://osd.state.tx.us Lloyd Potter, Ph.D.