Download

1 / 57
570 likes | 913 Views
Quantitative Structure-Activity Relationships Quantitative Structure-Property-Relationships QSAR & QSPR. Alexandre Varnek Faculté de Chimie, ULP, Strasbourg, FRANCE. History of QSAR. Dmitry Mendeleév (1834 – 1907). Discoverer of the Periodic Table — an early “Chemoinformatician ”.

E N D
Quantitative Structure-Activity Relationships Quantitative Structure-Property-Relationships QSAR & QSPR Alexandre Varnek Faculté de Chimie, ULP, Strasbourg, FRANCE
Dmitry Mendeleév(1834 – 1907) Discoverer of the Periodic Table — an early “Chemoinformatician” • Russian chemist who arranged the 63 known elements into a periodic table based on atomic mass, which he published in Principles of Chemistry in 1869. Mendeléev left space for new elements, and predicted three yet-to-be-discovered elements:Ga (1875), Sc (1879) and Ge (1886).
Periodic Table Chemical properties of elements gradually vary along the two axis
History of QSAR • 1868, D. Mendeleev – The Periodic Table of Elements • 1868, A. Crum-Brown and T.R. Fraser – formulated a suggestion that physiological activity of molecules depends on their constitution: Activity = F(structure) They studied a series of quaternized strychnine derivatives, some of which possess activity similar to curare in paralyzing muscle. • 1869, B.J. Richardson – narcotic effect of primary alcohols varies in proportion to their molecular weights.
History of QSAR • 1893, C. Richet has shown that toxicities of some simple organic compounds (ethers, alcohols, ketones) were inversely related to their solubility in water. • 1899, H. Meyer and 1901, E. Overton have found variation of the potencies of narcotic compounds with LogP. • 1904, J. Traube found a linear relation between narcosis and surface tension.
History of QSAR • 1937, L.P. Hammett studied chemical reactivity of substituted benzenes: Hammett equation, Linear Free Energy Relationship (LFER) • 1939, J. Fergusson formulated a concept linking narcotic activity, logP and thermodynamics. • 1952- 1956, R.W. Taft devised a procedure for separating polar, steric and resonance effects.
History of QSAR • 1964, C. Hansch and T. Fujita: the biologist’s Hammett equation. • 1964, Free and Wilson, QSAR on fragments. • 1970s – 1980s – development of 2D QSAR (descriptors, mathematical formalism). • 1980s – 1990s, development of 3D QSAR (pharmacophores, CoMFA, docking). • 1990s – present, virtual screening.
R H CH3 OCH3 F Cl NO2 ortho 6.27 12.3 8.06 54.1 11.4 671 meta 6.27 5.35 8.17 13.6 14.8 32.1 para 6.27 4.24 3.38 7.22 10.5 37.0 1934 - Hammett
Substituent Substituent Meta Para Meta Para O -0.708 -1.00 F +0.337 +0.062 OH +0.121 -0.37 Cl +0.373 +0.227 OCH3 +0.115 -0.268 CO2 H +0.355 +0.406 NH2 -0.161 -0.660 COCH3 +0.376 +0.502 CH3 -0.069 -0.170 CF3 +0.43 +0.54 (CH3)3Si -0.121 -0.072 SO2 Ph +0.61 +0.70 C6 H5 +0.06 -0.01 NO2 +0.710 +0.778 H 0.000 0.000 +N(CH3)3 +0.88 +0.82 SH +0.25 +0.15 N2 + +1.76 +1.91 SCH3 +0.15 0.00 +S(CH3)2 +1.00 +0.90 1934 - Hammett s s
Steric effects Taft quantified the steric (spatial) effects using the hydrolysis of esters: Here, the size of R affects the rate of reaction by blocking nucleophilic attack by water. In this case, the steric effects were quantified by the Taft parameter Es: k is the rate constant for ester hydrolysis. This expression is analogous to the Hammett equation.
H 0.00 the reference substituent in the Taft equation Me -1.24: little steric resistance to hydrolysis t-Bu -2.78 : large resistance to hydrolysis Compare some extreme values: Note: H is usually used as the reference substituent (Es(0)), but sometimes when another group, such as methyl (Me) is used as the reference, as in the chemical equation above, the value becomes 1.24.
Steric effects Es may be used in other chemical reactions and to explain biological activities, for example the hydrolysis of inhibitors of acetylcholine esterase. Organophosphates must be hydrolysed to be active and it is observed that their biological activity is directly related to the Taft steric parameter ES for the substituent R by the equation:
Octanol/water partition coefficient Usually, logP instead of P is used logP > 0, the compound prefers hydrophobic (unpolar) media logP > 0, the compound prefers polar media
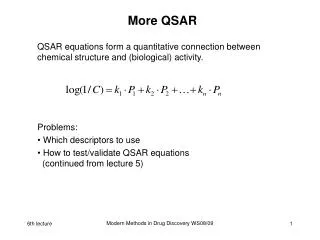
Hansch Analysis Biological Activity = f (EL, ST, HPh) + constant Biological Activity = log1/C C, drug concentration causes EC50, GI50, etc. EL (electronic descriptor): Hammett constant ( m, p, p0, p+, p-, R, F ) HPh (hydrophobicity descriptor): hydrophobic subst. constant, log P octanol/water partition coeff. ST (steric descriptor): Taft steric constant log1/C = a ( log P )2 + b log P + + Es + C Hansch, C.; Fujita, T. J. Am. Chem. Soc., 1964, 86, 1616.
Hansch Analysis Biological Activity = f (Physicochemical properties ) + constant • Physicochemical properties can be broadly classiied into three general types: • Electronic • Steric • Hydrophobic
Quantitative Structure Activity Relationship (QSAR) Quantitative structure-activity relationships correlate, within congeneric series of compounds, their chemical or biological activities, either with certain structural features or with atomic, group or molecular descriptors. Molecular Structure ACTIVITIES Representation Feature Selection & Mapping Descriptors Katiritzky, A. R. ; Lovanov, V. S.; Karelson, M. Chem. Soc. Rev.1995, 24, 279-287
Definition of molecular descriptor The molecular descriptor is the final result of a logic and mathematical procedure which transforms chemical information encoded within a symbolic representation of a molecule into a useful number or the result of some standardized experiment. Roberto Todeschini and Viviana Consonni
A complete description of all the molecular descriptors is given in: Handbook of Molecular Descriptors Roberto Todeschini and VivianaConsonni Methods and Principles in Medicinal Chemistry Volume 11 Edited by: H. Kubinyi R. Mannhold xx. Timmermann WILEY - VCH, Mannheim, Germany - 2000
Descriptors from Codessa Pro Descriptor Families Descriptors - calculable molecular attributes that govern particular macroscopic properties Topological Fragments Receptor surface Structural Information-content Spatial Electronic Thermodynamic Conformational Quantum mechanical Products Plus Molecular and Quantum Methods
Molecular Descriptors Classification based on the dimensionality of structure presentation • 1D (atom counts, MW, number of functional groups, …) • 2D (topological indices, BCUT, TPSA, Shannon enthropy, …) • 3D (geometrical parameters, molecular surfaces, parameters calculated in quantum chemistry programs, …)
Constitutional descriptors • number of atoms • absolute and relative numbers of C, H, O, S, N, F, Cl, Br, I, P atoms • number of bonds (single, double, triple and aromatic bonds) • number of benzene rings, number of benzene rings divided by the number of atoms • molecular weight and average atomic weight • Number of rotatable bonds (All terminal H atoms are ignored) • Hbond acceptor - Number of hydrogen bond acceptors • Hbond donor - Number of hydrogen bond donors These simple descriptors reflect only the molecular composition of the compound without using the geometry or electronic structure of the molecule.
Topological Descriptors Descriptors based on the molecular graph representation are widely used in QSPR, QSAR studies because they help to differentiate the molecules according mostly to their size, degree of branching, flexibility and overall shape.
TI based on the adjacency matrix • Total adjacency index: A = (1/2) • For G1 and G2, A = 5. • This TI can only distinguish between structures having different number of cycles (for cyclohexane A = 6).
TI based on the adjacency matrix :Zagreb group indices • M1 =M2 = where the vertex degreedi is a number of s bonds involving atom i excluding bonds to H atoms. Zagreb group indices were introduced to characterize branching
Zagreb group indices M1 =M2 = M1(G2) = 2*12 +4*22 = 18 M1(G2) = 2*(1*2) +3*(2*2) = 16 M1(G1) = 4*12 +2*32 = 22 M2(G1) = 4*(1*3) +1*(3*3) = 21 Randić’s molecular connectivity index Randic introduced a connectivity index similar to M2 R = M. Randić, J. Am. Chem. Soc., 97, 6609 (1975).
TI based on the Distance Matrix:the Wiener Index The entry dijof the distance matrix indicates the number of edges in the shortest path between vertices i and j. The Wiener index (the first TI !) accounts for the branching: W(G1)= 29 W(G2)= 35 Reference: H. Wiener, J. Am. Chem. Soc., 69, 17 (1947)
TPSA - Topological Polar Surface Area Peter Ertl, Bernhard Rohde, and Paul Selzer, J. Med. Chem. 2000, 43, 3714-3717
TPSA - Topological Polar Surface Area 3D PSA vs TPSA for 34 810 molecules from the World Drug Index
Geometrical descriptors • Moments of inertia • - rigid rotator approximation • - The moments of inertia characterize the mass distribution in the molecule. Area • - Molecular surface area descriptor • - Describes the van der Waals area of molecule • - related to binding, transport, and solubility 1. Rohrbaugh, R.H., Jurs, P.C., Anal.Chim. Acta, 1987. 199, 99-109. • Shadow indices1 • - Surface area projections Radius of gyration
Molecular thickness B L B L Steric parameters • Length-to-breadth ratio : L/B 1 • Molecular thickness • Ovality 2 (ratio of the actual surface area and minimum surface ) • Molecular volume • Sterimol parameters 3 • Taft steric parameter Es • Janini, G.M.; Johnston, K.; Zielinski, W. L. Anal. Chem. 1975, 47, 670. • Verloop, A.; Tipker, J. In Biological Activity and Chemical Structure, Buisman, J. A. K.(editors), Elsevier, Amsterdam, Netherlands, 1977, p63. • Kourounakis, A.; Bodor, N. Pharm. Res. 1995, 12(8), 1199.
Quantum Chemical Descriptors • Quantitative values calculated in QUANTUM MECHANICS (semi-empirical, HF Ab Initio or DFT ) calculations - Atomic charges (quant) - Atomic charges - LUMO - Lowest occupied molecular orbital energy • HOMO - Highest occupied molecular orbital energy • DIPOLE - Dipole moment • - Components of dipole moment along inertia axes (Dx, Dy, Dz) • Hf- Heat of formation • Mean Polarizability - = 1/3(xx+yy+zz) • EA – Electron Affinity • IP – Ionization Potential • E – Energy of Protonation • Electrostatic Potential -
Lipophilic Descriptors (2D and 3D)
Lipophilic Descriptors logP(octanol-water), logP(alkane-water), logP(chloroform-water), logP(dichloroethane/water) Octanol-water partition coefficient • Hansch-Leo method (ClogP) • Rekker's method • Ghose-Grippen method • (calculated logP based on summing contributions of atom types) • Molecular lipophilicity potential (MLP) • The MLP describe how lipophilicity is distributed all over the different parts of a molecule(lipophilicity maps and determination of hydro and lipophilic regions of a molecule)
Chloroform LogPo/w = 1.97 Secobarbital LogPo/w = 1.97 Irsogladine LogPo/w = 1.97 Trandolapril LogPo/w = 1.97 Acetyldigitoxine LogPo/w = 1.97 What do these Drugs have in Common?
3D Hydrophobicity hydrophobic hydrophilic All molecules have the same logP ~1.5, but different 3D MLP pattern.
Example of oral administration: • Drug is exposed to a large variety of pH values: • Saliva pH 6.4 • Stomach pH 1.0 – 3.5 • Duodenum pH 5 – 7.5 • Jejunum pH 6.5 – 8 • Colon pH 5.5 – 6.8 • Blood pH 7.4 • „Liver-first-pass-effect“ www.3dscience.com
Lipophilic Descriptors • Log D • Log PN : logP of the neutral form • Log PI : logP of the ionized form
logD – The Calculation • LogD may simply be calculated from predicted logP and pKa of the singly ionized species at certain pH: • For acids: logD(pH) = logP – log[1 + 10(pH - pKa)] • For bases: logD(pH) = logP – log[1 + 10(pKa - pH)]
Fragment Descriptors Descriptors: Cl, amide, COOH, Br, Phenyl Cl = 1 amide = 1 COOH = 1 Br = 0 Phenyl = 0
C-N=C-H C-N=C N=C-N C-N 2 to 4 atoms I(AB, 2-4) N=C C-H sequence Atoms+Bonds ISIDA Fragment descriptors Type of Fragments I. Sequences II. Augmented Atoms
II(A) (no hybridization) II(Hy) (hybridization of neighbours is taken into account) ISIDA Fragment descriptors Type of Fragments I. Sequences II. Augmented Atoms