Download
1 / 28
280 likes | 408 Views
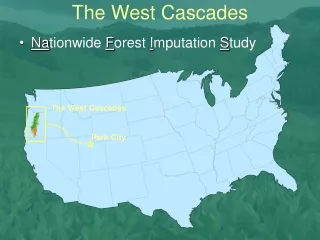
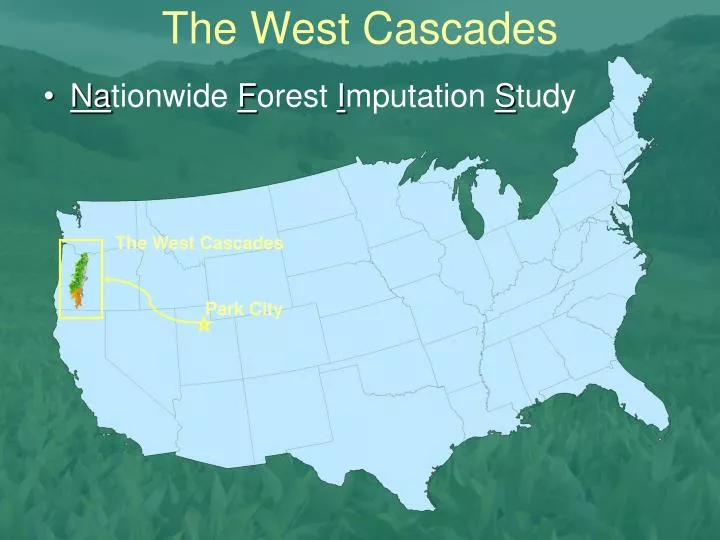
The West Cascades. Na tionwide F orest I mputation S tudy. The West Cascades. Park City. Gradients in Plant Community Ecology. Plant species exhibit distributional patterns that are a reflection of changing environmental conditions. Hierarchies from landscape ecology.

E N D
The West Cascades • Nationwide Forest Imputation Study The West Cascades Park City
Gradients in Plant Community Ecology • Plant species exhibit distributional patterns that are a reflection of changing environmental conditions.
Hierarchies from landscape ecology • “… a system of interconnections wherein the higher levels constrain the lower levels to various degrees...” (Turner et al. 2001) • Broad-scale, factors (e.g., climate) constrain local species pools. • Local topography, disturbance, succession and competition determine which species from that pool occupy a given site. CLIMATE Spatial Extent -------- > Disturbance Local Topography Time ------------------------------------->
Objective • Explore vegetation-environment relations in the context of imputation mapping. • Different modeling techniques make different assumptions about the world. • Euclidean Nearest Neighbor. • Gradient Nearest Neighbor. • Random Forest.
Methods • Maps built from: • 784 records from our plot database (FIA annual plots) • and 16 mapped explanatory variables.
Methods: Euclidean Nearest Neighbor Imputation (2) Place new pixel within feature space study area (4) impute nearest neighbor’s value to pixel (3) find nearest-neighbor plot within feature space feature space geographic space Elevation (1) Place plots within feature space Rainfall
Advantages Simplicity. Quick to run. Makes no assumptions about how vegetation relates to the environment. Disadvantages May not represent species-environment relations well. Pros and Cons: Euclidean Imputation
(2) calculate axis scores of pixel from mapped data layers study area (4) impute nearest neighbor’s value to pixel (3) find nearest-neighbor plot in gradient space Methods: Gradient Nearest Neighbor Imputation gradient space geographic space CCA Axis 2 (e.g., Temperature, Elevation) (1) conduct gradient analysis of plot data CCA Axis 1 (e.g., Rainfall, local topography)
Advantages to GNN Shapes environmental space as it relates to forest composition. Model structure is straightforward, reasonably intuitive. Disadvantage to GNN Assumes that species show a unimodal response to environmental gradients (Gauch, 1982; ter Braak and Prentice, 1988). Pros and Cons: Gradient Nearest Neighbor Imputation
Methods: Random Forest Nearest Neighbor Imputation study area Random Forest space geographic space ?
Elevation < 1244 August Maximum < 25.60 Temp August Maximum < 23.24 Temp Summer Mean < 12.79 Temp Aug. to Dec. Temperature < 12.79 Differential LANDSAT Band 5 < 24 Elevation < 1625 PSME PIPO TSHE PSME ABAM TSME PSME THPL Methods: Random Forest High Elevation ( > 1244) High August Temp (> 23.24°C) High reflectance in Band 5 (> 24) • One Classification Tree:
Methods: Random Forest • A “Forest” of classification trees. • Each tree is built from a random subset of plots and variables.
Methods: Random Forest Imputation 28 29 26 16 20 28 30 27 26 2 3 6 10 1 5 7 9 15 8 14 13 11 18 19 25 24 23 17 16 20
Advantages Models vegetation-environment relations Free from distributional assumptions High accuracy Disadvantages Computing time Interpretation is difficult Pros and Cons: Random Forest Imputation
Comparisons Root Mean Square Difference (RMSD) for species basal area. Mapped distribution (presence/absence) Douglas-fir (Pseudotsuga menziezii) Sugar Pine (Pinus lambertiana)
Accuracy(scaled RMSD) GNN Advantage Methods Equally Good Random Forest Advantage Euclidean model not shown. Results were comparable, but never best.
Douglas-fir • Often dominant. • Widespread, early colonizer, long-lived. • Only disappears at v. high elevations.
Douglas-fir Range Euclidean 78.0% GNN 59.2% Random Forest 74.3% Estimated Actual Area 79.77%
Douglas-fir Range Euclidean GNN Random Forest (scaled)
Sugar Pine • Spotty distribution, wide elevation range, mostly in the South.
Sugar Pine Range Euclidean 5.4% GNN 3.5% Random Forest 4.3% Estimated Actual Area 4.6%
Sugar Pine Range Euclidean GNN Random Forest (scaled)
Conclusions • The answer is... YES!! • The world can be seen as a gradient. • But in some cases, the world is better described by a hierarchy.
Conclusions: Which model? Broad-scale patterns are consistently predicted by all 3 model types. GNN works well most of the time. If rare, or quirky species are our focus, however, Random Forest may provide a very useful alternative. Both Random Forest and GNN are an improvement over simple euclidean imputation in terms of RMSD, but euclidean was often less biased in the range-maps.
The End. • Questions?