Download

1 / 28
280 likes | 384 Views
ABRF 2006 ESRG Study. Edman Sequencing as a Method For Polypeptide Quantitation. ESRG Committee Members. Daniel C. Brune (Chair) - Arizona State Univ. Brian Hampton - Univ. of Maryland, Baltimore, School of Medicine Ryuji Kobayashi - Univ. of Texas, M.D.

E N D
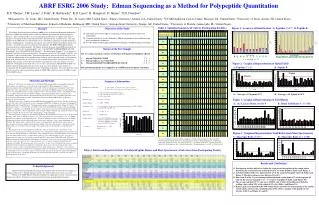
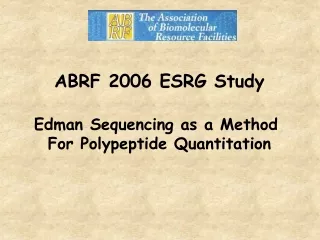
ABRF 2006 ESRG Study Edman Sequencing as a Method For Polypeptide Quantitation
ESRG Committee Members Daniel C. Brune (Chair) - Arizona State Univ. Brian Hampton - Univ. of Maryland, Baltimore, School of Medicine Ryuji Kobayashi - Univ. of Texas, M.D. Anderson Cancer Center Joseph W. Leone (Chair elect) - Pfizer Klaus D. Linse - Univ. of Texas, Austin Jan Pohl - Emory Univ. Richard S. Thoma - Monsanto Co. Nancy D. Denslow (ABRF liaison) - Univ. of Florida
Objectives of the Study • - Determine how accurate Edman sequencing • is for the quantitative analysis of • polypeptides • - Compare quantitative results obtained by • Edman sequencing to those obtained using • mass spectrometry techniques • - Test the ability of participating laboratories • to identify a modified amino acid residue
Description of the Test Sample Mixture of 3 Peptides (100 pmol/vial) lyophilized Peptide C 40 pmol RQAKVLLYSGR Peptide C* 40 pmol RQA(Ac-Lys)VLLYSGR Peptide B 20 pmol KAQYARSVLLEKDAEPD ILELATGYR - both unmodified peptides were supplied by the ABRF Peptide Standards Committee
Sample Preparation 1. Peptide C* synthesis and purification a. Synthesis on a Milligen 9050+ peptide synthesizer - FMOC chemistry b. Purified by HPLC - Jupiter Proteo C12 column (Phenomenex) c. Mass was verified using MALDI-TOF and Edman Sequencing d. Concentration determined by AAA 2. Peptides B & C each solubilized to 1mg/5mL in 10mM TFA/30% Acetonitrile
Sample Preparation (cont.) 3. Three peptides were mixed a. 15.25L C*, 59mL B, 51.6L C b. 1874L 10mM TFA/30% Acetonitrile 4. 10L aliquots placed in 0.6mL Eppendorf tubes (100 pmol/tube) 5. Dried in a Speed-Vac 6. Distributed 2 tubes per lab
Requested Information - The amino acid sequence of each peptide - Areas for peaks in each cycle - Areas, picomolar yields and retention times for each amino acid peak in the standard - Instrument information a. sequencer e. Gradient b. sample loading f. Solvents c. HPLC equipment g. Flow rate d. Column - 34 facilities requested the sample - 18 facilities returned sequencing data
Sequencer Information Manufacturer 8 ABI 49X-Ht and Model (5-14 yrs, Ave = 8.6) 10 ABI 49X-cLC (0-11 yrs, Ave. = 7.0) Reagents 15 all Manufacturers reagents 2 used some (R1, R2C, R4, R5 and Premix) 1 S4 was homemade TFA Cleavage 15 liquid, 3 gas-phase Sample Support 15 GFF, 3 PVDF DTT in S2 8 yes, 10 no Other additives 1 TCEP to R5
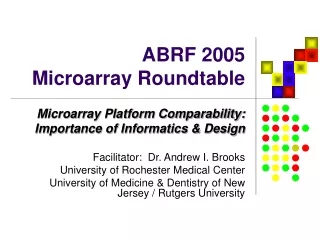
Labs Participating in ESRG Studies Number of Participating Labs Year
Accuracy of Identification Short Peptide (C* + C) K Ac-K Q A V L L Y S G R R Correct Calls Incorrect Calls Accuracy No Calls A Q Y A R S V L L E K D A E P D I L E L A T G Y R K Long Peptide (B) Cycle
Initial Yield Calculation 1. Log10 (AA pmol yield) Short Peptide 3(A),5(V),6(L),7(L),8(Y) Long Peptide 2(A),4(Y),5(A),8(V),9(L),10(L) 2. Plot data and determine best fit line Long Peptide Short Peptide y = - 0.0334x + 0.946 R2 = 0.834 y = - 0.0338x + 1.57 R2 = 0.9284 3. I.Y. = (antilog of y-intercept)/(% of sample tested) R.Y. = (antilog of slope)
Initial Yield Performance Short Peptide (C* + C) 80 pmol Ave. = 53.6pmol 67.0% Initial Yield (pmol) Long Peptide (B) 20 pmol Ave. = 13.1pmol 65.6% Lab ID
Initial Yield Ratio Short (C* + C) vs. Long (B) Peptide 4/1 ratio Ave. = 4.27/1 Ratio Lab ID 20 of 23 labs were between 3/1 and 5/1 ratios
Reasons for Low Initial Yield - Sample Washout - N-termini blocked a. interaction with the membrane b. chemical modification - Quality of reagents a. Biobrene (age or cycles performed) b. EtOAc (> 6 months) - Poor solubility during reconstitution - Specific Low Yielding Amino Acids (e.g. Cys, Trp, Ser, Arg) - Non-linear Repetitive Yield - Small amount of sample analyzed
Initial Yield - Short Peptide (C* + C) Slope Calculations Sequence - RQAK*VLLYSGR 200 220 110 300 100 500 550 400 440 330 Log 10 (pmol) 770 800 600 660 700 1 2 990 880 900 3 4 5 ABRF ESRG2006 Cycle #
Initial Yield - Long Peptide (B) Slope Calculations Sequence -KAQYARSVLLEKDAEPDILELATGYR 110 100 220 200 300 550 400 440 330 500 Log 10 (pmol) 800 770 660 600 700 2 1 990 900 880 4 5 3 ABRF ESRG2006 Cycle #
Initial Yield vs Linearity Short Peptide (C* + C) Initial Yield (pmol) Long Peptide (B) Linearity (R2)
Linearity (R2 > 0.9) Short Peptide - 5 labs (22%) Long Peptide - 10 labs (43%) Accuracy ( 50% from expected) Short Peptide (40-120 pmol) - 16 labs (70%) Long Peptide (10-30 pmol) - 19 labs (83%)
Initial Yield vs Amount Analyzed Short Peptide (C* + C) Initial Yield (pmol) Long Peptide (B) Percent of Test Sample Sequenced
MALDI-TOF M+H 1290.81 1332.83 % Intensity 2949.73 Initial Yield Edman Sequencing vs Mass Spectrometry Mass (m/z)
Mass Spec Ratio Short (C* + C) vs. Long (B) Peptide Ave. = 22.4/1 Std Dev. = 30.6 4/1 ratio Ratio Lab ID 3 of 16 labs were between 3/1 and 5/1 (Not enough data to separate MS instrumentation) Instrumentation MALDI 16 ESI or Ion Trap 5 Not reported 3
The Modified Amino Acid Acetyl-Lysine Cycle 4 DPTU Ac-K K Y PTH Standard D N Q E G S T A H Y K V W M R P DPTU F L I 13 of 18 labs correctly identified the modified peptide
Area Ratio Short (C* vs C) Peptide Ave. = 1.5/1 1/1 ratio Ratio Lab ID 16 of 21 labs were between 0.5/1 and 1.5/1
Mass Spec Ratio Short (C* vs C) Peptide Ave. = 2/1 1/1 ratio Ratio Lab ID 8 of 15 labs were between 0.5/1 and 1.5/1
Conclusions • - Edman sequencing tends to underestimate • initial yields by approximately 1/3. Most • lab data was within a factor of 2 from the • expected accuracy. • Edman Sequencing produced very accurate • peptide to peptide ratios. Mass • Spectrometry produced far less accurate • ratio data. • The majority of labs were able to identify • the modified amino acid – Acetylated lysine
Acknowledgements Thanks to all the participating laboratories for taking the time to analyze the test sample and sending in their results. Without their participation, this effort would not have been successful. Thanks to the Henriette Remmer from the ABRF Peptide Standards committee for supplying two of the synthetic peptides. Thanks also to Renee Schrauben for removing identifiers from the responding laboratories.
Congratulations to “Joe Leone” On his election as ESRG Chair!
Suggested Future ESRG Studies 1. Deblocking a Protein 2. Sequencing a Very Large Protein on a PVDF Membrane 3. Internal Cleavage Analysis 4. Repetitive Yield Study 5. Protein Mixture or an Antibody 6. Very Hydrophobic Peptides 7. More Tips on Unusual Amino Acids 8. Phosphorylated and/or Glycosylated Proteins 9. Alkylated Cysteine 10. Evaluation of PVDF Membranes and Transfer Techniques 11. Low Protein Concentrations (< 2 pmol) 12. Quantitation of Post-Translational Modifications