Download
1 / 45
450 likes | 531 Views
Steady-State Analysis of New England’s Interstate Pipeline Delivery Capability. Presentation to the NEPOOL Participants Committee. January 5 th , 2001. Levitan & Associates, Inc. www.levitan.com. Levitan & Associates, Inc. (LAI) Practice Areas.

E N D
Steady-State Analysis of New England’s Interstate Pipeline Delivery Capability Presentation to the NEPOOL Participants Committee January 5th, 2001 Levitan & Associates, Inc. www.levitan.com
Levitan & Associates, Inc. (LAI) Practice Areas • Energy Markets Simulation and Optimization Modeling • Merchant Generation Economics • Pipeline Transportation Management • Fuel Supply Procurement • Power System Engineering/Heat Balance Optimization • ISO Interconnection Policy and Pricing • NUG Contract Administration (Reformation and Buyouts) • Environmental Compliance Strategy • Litigation Support January 5, 2001
Steady-State Analysis of New England’s Interstate Pipeline Delivery Capability • What the Study Is & Is Not • Individual & Consolidated Models • Steady-State Perspective • No Temporal & Force Majeure January 5, 2001
New England Natural Gas Supply Sources January 5, 2001
M&N PNGTS Tennessee Iroquois Algonquin New England’s Interstate Pipelines January 5, 2001
Western Canadian Gas thru TCPL, Iroquois and PNGTS Eastern Canadian Gas thru M&N Western Canadian Gas thru Tennessee LNG from Algeria and Trinidad Gulf Coast Gas thru Algonquin And Tennessee New England’s Interstate Pipelines January 5, 2001
Confidentiality • ISO-NE & LAI has and will continue to comply with the NEPOOL Information Policy - Rev 3, dated August 10, 2000 • Proprietary Information kept Confidential • Steady-State hydraulic model developed from interstate pipeline public domain information • FERC 567 Reports & FERC Flow Diagrams Reflecting Peak Day Design January 5, 2001
Steady-State Highlights • No pipeline delivery constraints on a peak day in Winter 2000-01 • No summer peak day pipeline deliverability constraints through 2005 • Delivery constraints are apparent in Winter 2003 • Shortfall in gas requirements 1,755 MW out of 8,946 MW assumed • There are 71 gas-fired units, 51 of which are dual fueled • Delivery constraints intensify by Winter 2005 • Shortfall in gas requirements 3,226 MW out of 11,579 MW assumed • There are 75 gas-fired units, 54 of which are dual fueled • Theoretical mitigation potential thru back-up fuel January 5, 2001
Projected Shortfalls in Gas Requirements (MW)* * 6970 Btu/kWh 2001 2003 2005 January 5, 2001
Summary of Peak Day Scenarios – Total Regional Demand vs. System Capacity January 5, 2001
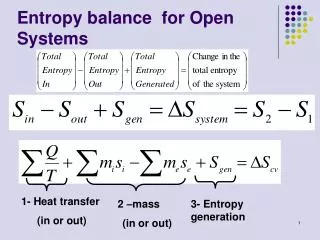
Year Scenario Forecast Pipeline Demand (MMcf/d) Unserved Merchant LDCs Merchant Generators Volumes (MMcf/d) Capacity (MW) 2001 Winter Peak Day High 2617 751 --- --- 2003 Winter Peak Day Reference 2837 872 189 1164 Winter 60-Day Reference 2837 804 72 443 Winter Peak Day High 2837 880 285 1755 Winter 60-Day High 2837 861 191 1176 2005 Winter Peak Day Reference 2837 907 241 1484 Winter 60-Day Reference 2837 782 76 468 Winter Peak Day High 2837 906 524 3226 Winter 60-Day High 2837 867 513 3159 Summer Peak Day High 406 1501 --- --- Steady-State Modeling Results Unserved merchant capacity does not take into account back-up fuel capabilities. January 5, 2001
Back-up Fuel Issues • Infrastructure • Air Permits • Delivery Logistics • Tankage • Refill • Operational Constraints, e.g. switch-on-the-fly • Sustainability January 5, 2001
Case New Entry (MW) Back-up Fuel Capability (MW) Peak Day Gas Available w/ Back-up Fuel Use (MMcf) Peak Day Transport Shortfall (MMcf) Excess or Shortfall w/ Back-up Fuel Use (MMcf/d) Reference 7,551 2,263 382.5 241.0 141.5 High 11,579 5,890 971.5 524.0 447.5 Mitigation Potential January 5, 2001
Contingency Cases • ISO Contingencies • Loss of Major Gas-fired Generating Unit • Loss of 2000 MW HydroQuebec Phase II Line • Gas Contingencies • Scenario 1 - Loss of compression at Burrillville on Algonquin • Scenario 2 - Loss of compression at Agawam on Tennessee • Scenario 3 - Loss of 36-inch line on Tennessee January 5, 2001
ISO Contingency: Loss of Major Gas-Fired Generating Unit • No significant loss of pressure or flows • Interstate pipelines have the ability to divert and/or re-route gas along the 1100-mile transportation path January 5, 2001
ISO Contingency: Loss of 2000 MW HydroQuebec Phase II Line • Winter Peak Day - System cannot transport any additional gas • Summer Peak Day - More than sufficient pipeline capacity to support replacement gas fueled generation January 5, 2001
Available compression capacity at Burrillville on Algonquin derated from 11,400 hp to 5,700 hp Gas Contingency Scenario 1 January 5, 2001
Gas Contingency Scenario 1 • Increased horsepower requirements at other compressor stations • Fall in delivery pressures to levels that could disrupt plant operations • No observed impact on other pipelines January 5, 2001
Available compression capacity at Agawam on Tennessee derated from 9,760 hp to 3,253 hp Gas Contingency Scenario 2 January 5, 2001
Gas Contingency Scenario 2 • Downstream compressor stations able to make-up for loss • No unacceptably low delivery pressures for merchant plants observed • No impact on other pipelines January 5, 2001
7 miles of Tennessee’s 36-inch line at NY-MA border removed Gas Contingency Scenario 3 January 5, 2001
Gas Contingency Scenario 3 • Downstream compressors able to compensate for pressure loss January 5, 2001
Recommendations • Certify quality of interstate transportation arrangements • Advocate the streamlining of FERC’s pipeline certification process • Promote coordination of power and natural gas scheduling protocols • Increase understanding of merchant generators’ fuel-switching capabilities January 5, 2001
Steady-State Demand Assumptions Two Gas Demand Cases developed by ISO-NE & LAI: Reference Case & High Case January 5, 2001
Electric Assumptions • ISO-NE develops electric side assumptions • PROSYM production simulation model • Analysis performed for 2000 - 2005 • ISO-NE assumptions for: • projected NEPOOL loads, • existing & proposed capacity and capacity attrition • net-interchange with New York, New Brunswick and Hydro-Quebec • ISO-NE delivers hourly gas demands for NEPOOL units for peak day (summer/winter) and 60 day winter average (Dec 15th thru Feb 15th) January 5, 2001
Load Profiles and Seasonality • Winter • Reliance on Peak Day System Flow diagrams from various certificate applications to serve merchant generators • Summer • Statistical inference from LDCs’ normalized sales January 5, 2001
Merchant Entry in New England (High Case) January 5, 2001
Merchant Entry by Pipeline January 5, 2001
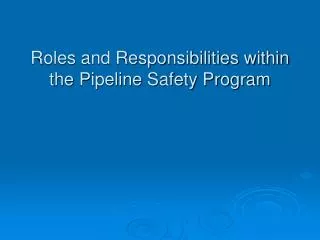
Pipeline Winter MW MMcf/d Iroquois 1118 163.2 Tennessee 2654 479.7 Algonquin 2645 440.7 M&N 2698 278.2 PNGTS 443 67.3 Merchant Entry by Pipeline* (2005 High Case) * No LNG units January 5, 2001
Heat Rate vs. Gas Requirements January 5, 2001
Gregg’s WinFlow Steady-State Model • WinFlow is a shell, requiring extensive and elaborate customization • WinFlow calculates the balanced steady-state pressure-flow relationships for pipeline networks January 5, 2001
Validation of Steady-State Models • Each individual interstate pipeline model matched its Peak Day Flow diagram within industry tolerances • 5# psi • 10 hp • Steady-state models for Algonquin, Tennessee and M&N were reviewed and informally validated with individual pipelines January 5, 2001
Scheduling Priorities during Constraints • Primary Firm Transportation LDCs, to a lesser extent, QFs and some merchants • Secondary Firm Transportation (quasi-firm) Marketers and merchant generators • Interruptible Transportation Industrials, merchant generators January 5, 2001
New England Natural Gas Infrastructure • New England’s Major Interstate Pipelines • Iroquois • Portland • Algonquin • Maritimes & Northeast • Tennessee • Existing pipeline delivery capacity = 3.6 Bcf/d. • Daily LNG sendout capability at Everett = 0.450 Bcf/d. • Expansion of 0.60 Bcf/d for 1,550 MW Sithe New Mystic Station, possibly Island End • About 1.4 Bcf/d peak day deliverability behind the citygates • Liquids via truck 0.1 Bcf/d January 5, 2001
Interstate Transportation Market Dynamics • 14 pipeline projects placed in-service during 1999-’00 + 2.0 Bcf/d in the Greater Northeast • New Pipelines in New England, M&N and PNGTS, result in + 0.615 Bcf/d, or about 3800 MW • Counterflow capability through Dracut Tennessee • Pressure and flow benefits improve network reliability • New LNG supplies from Trinidad • Commoditization of the “Supply Chain” • Repackaged Btu services • Synthetics • Increased liquidity • Risk management January 5, 2001
LNG/Propane Storage Withdrawals Pipeline Storage Injections Typical New England LDC Daily Gas Send-Out Source: WEFA, Northeast Natural Gas Markets, Opportunities and Risks, November 1998 January 5, 2001
LAI Project Team • John Pitts Senior Consultant • John Mesko, P.E. Senior Consultant • Lilly Zhu Consultant • Shilpa Shah Assistant Consultant • Richard Levitan Principal • John Bitler Principal • Edward McGee, P.E. Managing Consultant • Jack Elder, P.E. Manager, Power Systems and Technology January 5, 2001
Levitan & Associates, Inc.www.levitan.comTel: 617-531-2818Email: rll@levitan.com