Download
1 / 1
10 likes | 149 Views
Modeling Impacts of Water Management on Crop Yield, Water Use Efficiency and GHG Emissions for Rice Production in Asia Changsheng Li 1 , Xiangming Xiao 1 , Steve Frolking 1 , Berrien Moore 1 , and William Salas 2

E N D
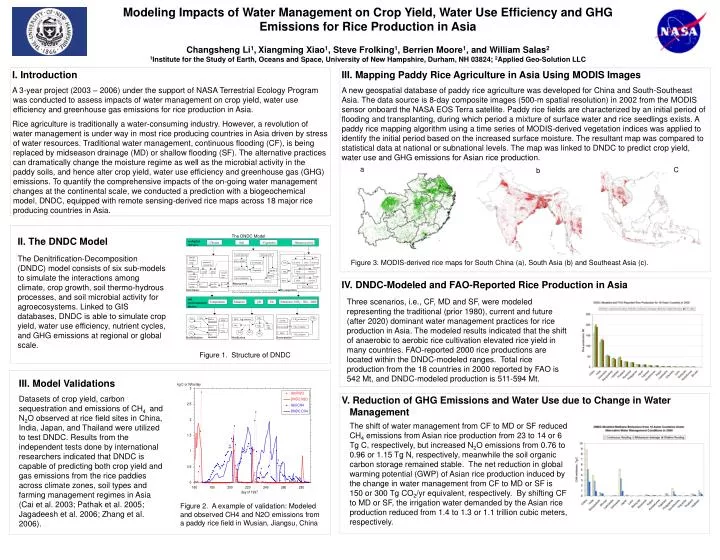
Modeling Impacts of Water Management on Crop Yield, Water Use Efficiency and GHG Emissions for Rice Production in Asia Changsheng Li1,Xiangming Xiao1, Steve Frolking1, Berrien Moore1, and William Salas2 1Institute for the Study of Earth, Oceans and Space, University of New Hampshire, Durham, NH 03824; 2Applied Geo-Solution LLC • Introduction • A 3-year project (2003 – 2006) under the support of NASA Terrestrial Ecology Program was conducted to assess impacts of water management on crop yield, water use efficiency and greenhouse gas emissions for rice production in Asia. • Rice agriculture is traditionally a water-consuming industry. However, a revolution of water management is under way in most rice producing countries in Asia driven by stress of water resources. Traditional water management, continuous flooding (CF), is being replaced by midseason drainage (MD) or shallow flooding (SF). The alternative practices can dramatically change the moisture regime as well as the microbial activity in the paddy soils, and hence alter crop yield, water use efficiency and greenhouse gas (GHG) emissions. To quantify the comprehensive impacts of the on-going water management changes at the continental scale, we conducted a prediction with a biogeochemical model, DNDC, equipped with remote sensing-derived rice maps across 18 major rice producing countries in Asia. III. Mapping Paddy Rice Agriculture in Asia Using MODIS Images A new geospatial database of paddy rice agriculture was developed for China and South-Southeast Asia. The data source is 8-day composite images (500-m spatial resolution) in 2002 from the MODIS sensor onboard the NASA EOS Terra satellite. Paddy rice fields are characterized by an initial period of flooding and transplanting, during which period a mixture of surface water and rice seedlings exists. A paddy rice mapping algorithm using a time series of MODIS-derived vegetation indices was applied to identify the initial period based on the increased surface moisture. The resultant map was compared to statistical data at national or subnational levels. The map was linked to DNDC to predict crop yield, water use and GHG emissions for Asian rice production. a C b II. The DNDC Model The Denitrification-Decomposition (DNDC) model consists of six sub-models to simulate the interactions among climate, crop growth, soil thermo-hydrous processes, and soil microbial activity for agroecosystems. Linked to GIS databases, DNDC is able to simulate crop yield, water use efficiency, nutrient cycles, and GHG emissions at regional or global scale. Figure 3. MODIS-derived rice maps for South China (a), South Asia (b) and Southeast Asia (c). IV. DNDC-Modeled and FAO-Reported Rice Production in Asia Three scenarios, i.e., CF, MD and SF, were modeled representing the traditional (prior 1980), current and future (after 2020) dominant water management practices for rice production in Asia. The modeled results indicated that the shift of anaerobic to aerobic rice cultivation elevated rice yield in many countries. FAO-reported 2000 rice productions are located within the DNDC-modeled ranges. Total rice production from the 18 countries in 2000 reported by FAO is 542 Mt, and DNDC-modeled production is 511-594 Mt. Figure 1. Structure of DNDC III. Model Validations Datasets of crop yield, carbon sequestration and emissions of CH4 and N2O observed at rice field sites in China, India, Japan, and Thailand were utilized to test DNDC. Results from the independent tests done by international researchers indicated that DNDC is capable of predicting both crop yield and gas emissions from the rice paddies across climate zones, soil types and farming management regimes in Asia (Cai et al. 2003; Pathak et al. 2005; Jagadeesh et al. 2006; Zhang et al. 2006). V. Reduction of GHG Emissions and Water Use due to Change in Water Management The shift of water management from CF to MD or SF reduced CH4 emissions from Asian rice production from 23 to 14 or 6 Tg C, respectively, but increased N2O emissions from 0.76 to 0.96 or 1.15 Tg N, respectively, meanwhile the soil organic carbon storage remained stable. The net reduction in global warming potential (GWP) of Asian rice production induced by the change in water management from CF to MD or SF is 150 or 300 Tg CO2/yr equivalent, respectively. By shifting CF to MD or SF, the irrigation water demanded by the Asian rice production reduced from 1.4 to 1.3 or 1.1 trillion cubic meters, respectively. Figure 2. A example of validation: Modeled and observed CH4 and N2O emissions from a paddy rice field in Wusian, Jiangsu, China