Download
1 / 30
300 likes | 302 Views
Explore the concept of allocation trade-offs in life history ecology, including maturation time, fecundity vs. survival, growth vs. reproduction, and size vs. number of offspring.

E N D
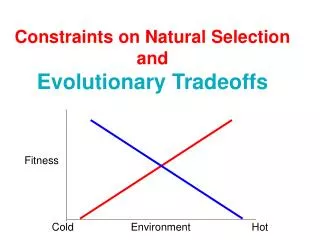
In the last lecture, in presenting the concept of allocation, I introduced the idea that evolved strategies must involve trade-offs, among allocations to different functions and among approaches to reproduction for example. Today we will examine some of those trade-offs…
There are a number of tradeoffs that life history ecology has studied: • Maturation time ( or age of first reproduction) versus survivorship. In the extreme you’ve already seen “r” versus K strategies. It’s really a continuum…
2. A tradeoff between fecundity and survival – if a female produces more offspring, each energetically costly, that decreases the amount of energy she can put into ‘storage’ to help her get through hard times. Reduced energy going towards maintenance and survivorship means higher mortality and, on average, a shorter lifespan. It also means that, even if the organism does survive, it will have less energy to devote to future bouts of reproduction (and likely fewer offspring. Check out the model of the balance between gain in reproductive output and reduction in survivorship on pp. 210-211 of the text.
3. There is a tradeoff between growth and fecundity. This should follow logically from the other tradeoffs: energy spent on reproduction clearly cannot be spent on growth. This tradeoff is important to those species that show indeterminate growth. Rather than reaching an ‘individual organism carrying capacity’ (an equilibrium adult size), these organisms continue to grow (though usually at a slow rate) even as adults. Fish are good examples. Why keep growing? Because a female fish produces a number of eggs that is proportional to her body size: larger means more eggs and more young.
4. Tradeoffs between size and number of offspring – We know that evolution selects the strategy that produces the highest lifetime reproductive success, but how? Optimization. One well worked-out example is clutch size in birds. David Lack studied clutch size in European starlings… Clutch size in the starling varies over a maximum range from 1 to 10 eggs. How do we determine whether there is an optimal clutch size and what that size is? Is a larger number of eggs better?
Success means producing young who themselves survive to reproduce. So, we begin with how many of the clutch of eggs successfully hatch. Then we ask how many of the hatched eggs are successfully fledged. Finally, we ask how many survive the winter to reach reproductive maturity.
First, hatching success. It isn’t perfect, but very close, and increases linearly with the number of eggs in the clutch. Just less than 1 egg hatches from a 1 egg clutch, and almost exactly 4.5 hatch from a 5 egg clutch.
Following hatching, the nestlings are fed by the parents. Lack believed that feeding was the key, either due to food availability or to a lack of time to find and gather food for the young. The number of young surviving to be fledged decreases with clutch size.
The number of young fledged (recruits) is the product of the number hatched times the proportion surviving the nestling period. Here’s an example from Lack’s data… Clutch size hatchedprop. fledgedrecruits 1 1 1.0 1 2 1.8 0.95 1.71 3 2.7 0.85 2.29 4 3.6 0.75 2.7 5 4.5 0.6 2.7 6 5.3 0.45 2.38 The number of recruits peaks at either 4 or 5 eggs. Overwinter mortality turned out to be a simple % of fledglings.
What this shows is that there is no point in “cheating”. Laying extra eggs (beyond the 4 or 5 egg optimum) does not lead to leaving behind a larger number of recruits. That would correspond to increased fitness. There is additional energetic cost to producing more eggs, but no added benefit. Instead, optimization occurs at some intermediate number of eggs that is most successful at producing recruits. Now the background for the first clicker question: Starlings typically produce a second clutch of eggs each breeding season. However, it is late enough that the amount of food and time to harvest it to feed nestlings are lower.
There are a number of reasons for these results. When a female lays more eggs, each offspring is likely to be smaller. Smaller offspring are less likely to survive the nestling period, and much less likely to survive the winter. Here are nestling weights at 15 days of age: Clutch size nestling weight 2 88 g 5 77.6 g 7 71.4 g A general principle: An important tradeoff is that between size and number of offspring.
20 Assuming that there is an optimum size for this second clutch, what number of eggs do you think is optimal? • 1 or 2 eggs • 3 or 4 eggs • 5 or 6 eggs • 7 or 8 eggs
In the example of the starlings, because parents in many bird species are severely limited by the amount of time they have to feed the young… It is possible to test for optimality in clutch size experimentally. Perrins used captive swifts and placed different numbers of eggs in their nests. The clutch sizes he observed, at least in the optimal number, match observations in the field...
The trade-offs between offspring size and number are also evident in plants. Goldenrods (genus Solidago) are among the most widely studied plants. Different species grow in woods, climax grassland, and old fields. Their reproductive patterns clearly indicate both patterns in allocation and in size-number trade-offs. First, allocation differences among species growing in different habitats, and even individuals of the same species growing in those habitats... In a comparison of goldenrods by Abrahamson & Gadgil…
Wet site – a moderately open Meadow Woods site – even at the edge, it’s shady Dry site – very open and sunny
Species from the woods site, shaded, have less energy to • allocate to reproduction than those from a wetter site, and • much less than those from a dry site. • The dry site is open, plants are typically smaller, but get • full sun. • The wet site is more densely vegetated, but with plants of • similar stature as the goldenrods. • However, this does not indicate trade-offs between offspring • size and number. For that data we look instead to a • comparative study by Werner & Platt...
These goldenrods were all growing on Cayler Prairie, Iowa. They are ordered from dry to wet areas on the prairie. They don’t follow the pattern perfectly (S. speciosa messes it up), but, in general, plants producing larger seeds make less. Species Wt. # Wt. x # S. nemoralis 104. 200 20,800 S. missourensis 39.3 1100 43,230 S. speciosa 146.3 500 73,150 S. canadensis 58.3 1100 64,130 S. graminifolia 10.6 7800 82,680 A more general pattern was also described among goldenrods in a variety of differing habitats…
The slope of the line in the previous figure is statistically indistinguishable from -1, i.e. the product of seed size and seed number is a constant. This suggests that the allocation of energy to reproduction in all these closely related species is the same. Even if it isn’t the same, we would expect similarity among closely related species as a result of their descent from a common ancestor.
Optimal clutch size is a consequence of natural selection, and reflects the environment in which a population lives. Though “clutch size” is a term usually referring to birds (or other species that lay eggs), the principle applies to all types of reproductive output. Clutch size will vary among species as a result of evolved optimization. Even for the same species, optimal clutch size will vary from year to year and place to place due to environmental variation. Clutches that are either too large or too small are not favoured because they result in fewer recruits to the next generation produced successfully.
Thus far, we have considered evolution of optima as if the selected phenotypes were fixed, that there is a one-to-one mapping from genotype to phenotype. Is that really true? There is another form of adaptation (and it, too, results from selection): Phenotypic plasticity The expression of the genotype is the phenotype. Environmental conditions affect that expression, and variation in the expressed phenotype under differing environmental conditions is called phenotypic plasticity. The capacity to vary phenotype can be (and is) selected.
The relationship between phenotype and some environmental factor that affects its expression is called a reaction norm.
If two populations within a species have long lived under differing environmental conditions, their reaction norms may differ. Fig. 10.6 shows you that reaction norms for Michigan and Alaska populations of Papilio (swallowtail butterflies) differ. The Michigan population shows a larger reaction to increasing temperature than the Alaskan population. That indicates the selective impact of exposure to different environments over a long (evolutionary) time.
When reaction norms cross (genotype A does better than B in one environment, the reverse is true in a second environment), this difference indicates the presence and impact of a genotype-environment interaction. The modular nature of plant architecture makes the occurrence of both phenotypic plasticity and genotype-environment interactions common in plants – through alteration in the number and size of modules.
You can investigate the differences in populations and their response to environmental conditions by means of reciprocal transplant experiments… The observed initial observation is in the first box: the two populations have different observed phenotypes in their home environments.
If the phenotypes are invariant in the reciprocal transplant experiment (the 2nd box), then the differences observed are entirely genetic. If both populations show the same (or parallel) reaction norms, then the observed difference is solely due to phenotypic plasticity. Both populations are responding in the same way. If the reaction norms have different slopes, then species respond in different ways. The fact they respond indicates the presence of phenotypic plasticity; the difference in response indicates evolved genotypic difference.
Reaction norms are evident in the developmental response to differing environments. One of the good examples is in maturation of species measured by their age and size at reaching sexual maturity…
And here’s how a reaction norm is evident as a response to food conditions (environmental quality) in metamorphosis from tadpole to frog:
20 Which of the following correctly describes frog metamorphosis evident in the reaction norm? • Frogs metamorphose at younger age in a ‘high food’ environment • Frogs metamorphose at a smaller size in a ‘high food’ environment • Frogs metamorphose when they are older in a ‘high food’ environment • Frogs metamorphose at a larger size in a ‘high food’ environment. • Both 1 and 4 are correct • Both 2 and 3 are correct