Download
1 / 1
10 likes | 147 Views
Design and Implementation of an Operational Tsunami Forecast Tool.

E N D
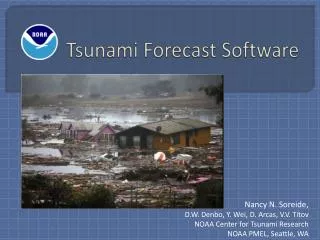
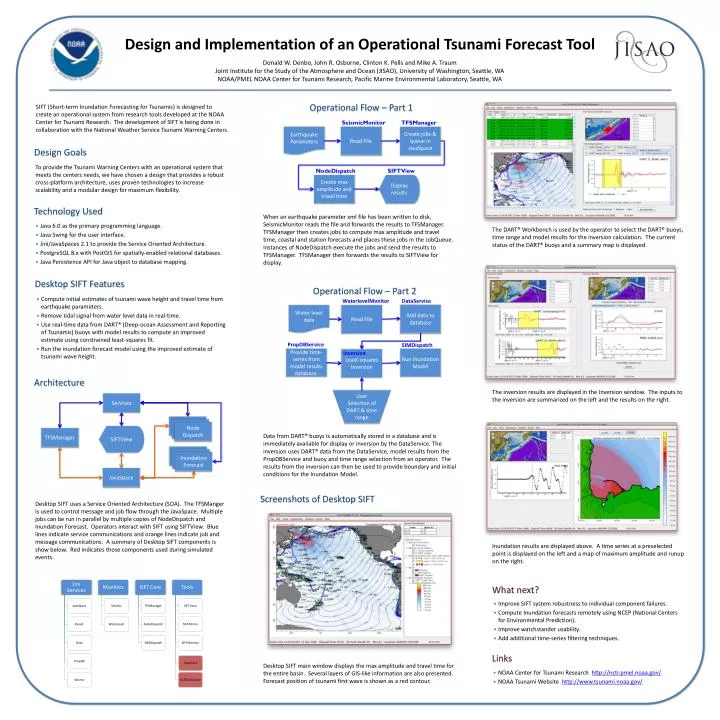
Design and Implementation of an Operational Tsunami Forecast Tool Donald W. Denbo, John R. Osborne, Clinton K. Pells and Mike A. TraumJoint Institute for the Study of the Atmosphere and Ocean (JISAO), University of Washington, Seattle, WANOAA/PMEL NOAA Center for Tsunami Research, Pacific Marine Environmental Laboratory, Seattle, WA Operational Flow – Part 1 SIFT (Short-term Inundation Forecasting for Tsunamis) is designed to create an operational system from research tools developed at the NOAA Center for Tsunami Research. The development of SIFT is being done in collaboration with the National Weather Service Tsunami Warning Centers. SeismicMonitor TFSManager Earthquake Parameters Read File Create jobs & queue in JavaSpace Design Goals To provide the Tsunami Warning Centers with an operational system that meets the centers needs, we have chosen a design that provides a robust cross-platform architecture, uses proven technologies to increase scalability and a modular design for maximum flexibility. NodeDispatch SIFTView Create max amplitude and travel time Display results Technology Used When an earthquake parameter xml file has been written to disk, SeismicMonitor reads the file and forwards the results to TFSManager. TFSManager then creates jobs to compute max amplitude and travel time, coastal and station forecasts and places these jobs in the JobQueue. Instances of NodeDispatch execute the jobs and send the results to TFSManager. TFSManager then forwards the results to SIFTView for display. • Java 6.0 as the primary programming language. • Java Swing for the user interface. • Jini/JavaSpaces 2.1 to provide the Service Oriented Architecture. • PostgreSQL 8.x with PostGIS for spatially-enabled relational databases. • Java Persistence API for Java object to database mapping. The DART® Workbench is used by the operator to select the DART® buoys, time range and model results for the inversion calculation. The current status of the DART® buoys and a summary map is displayed. Desktop SIFT Features Operational Flow – Part 2 • Compute initial estimates of tsunami wave height and travel time from earthquake parameters. • Remove tidal signal from water level data in real-time. • Use real-time data from DART® (Deep-ocean Assessment and Reporting of Tsunamis) buoys with model results to compute an improved estimate using constrained least-squares fit. • Run the inundation forecast model using the improved estimate of tsunami wave height. WaterlevelMonitor DataService Add data to database Water level data Read File PropDBService SIMDispatch Provide time-series from model results database. Inversion Run Inundation Model Least-squares Inversion Architecture The inversion results are displayed in the Inversion window. The inputs to the inversion are summarized on the left and the results on the right. User Selection of DART & time range Services Dispatch Node Dispatch Node Node Dispatch SIFTView TFSManager Data from DART® buoys is automatically stored in a database and is immediately available for display or inversion by the DataService. The inversion uses DART® data from the DataService, model results from the PropDBService and buoy and time range selection from an operator. The results from the inversion can then be used to provide boundary and initial conditions for the Inundation Model. Inundation Forecast Inundation Forecast Inundation Forecast JavaSpace Screenshots of Desktop SIFT Desktop SIFT uses a Service Oriented Architecture (SOA). The TFSManger is used to control message and job flow through the JavaSpace. Multiple jobs can be run in parallel by multiple copies of NodeDispatch and Inundation Forecast. Operators interact with SIFT using SIFTView. Blue lines indicate service communications and orange lines indicate job and message communications. A summary of Desktop SIFT components is show below. Red indicates those components used during simulated events. Inundation results are displayed above. A time series at a preselected point is displayed on the left and a map of maximum amplitude and runup on the right. What next? • Improve SIFT system robustness to individual component failures. • Compute Inundation forecasts remotely using NCEP (National Centers for Environmental Prediction). • Improve watchstander usability. • Add additional time-series filtering techniques. Links Desktop SIFT main window displays the max amplitude and travel time for the entire basin. Several layers of GIS-like information are also presented. Forecast position of tsunami first wave is shown as a red contour. • NOAA Center for Tsunami Research http://nctr.pmel.noaa.gov/ • NOAA Tsunami Website http://www.tsunami.noaa.gov/