Download
1 / 1
10 likes | 91 Views
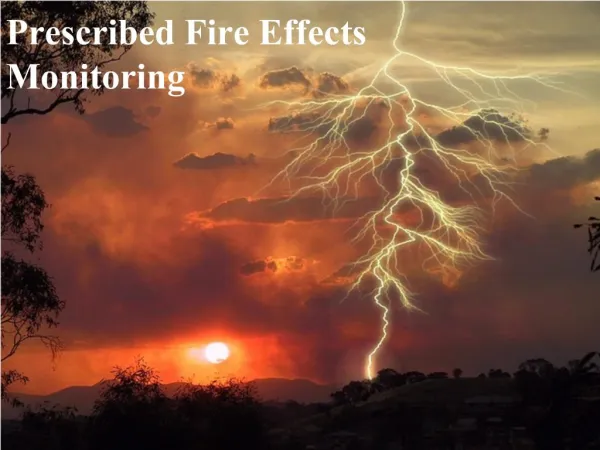
Introduction:

E N D
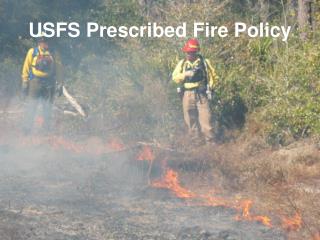
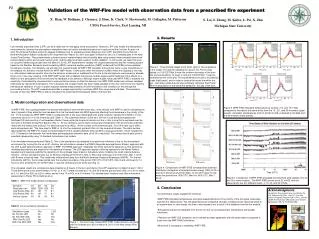
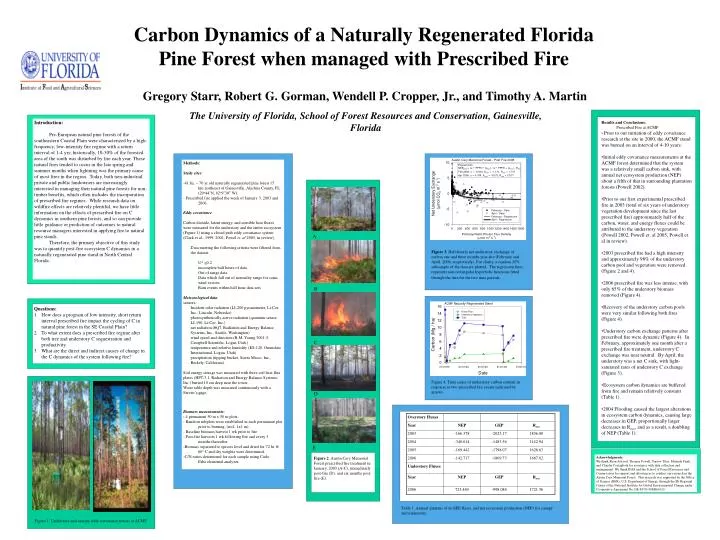
Introduction: Pre-European natural pine forests of the southeastern Coastal Plain were characterized by a high-frequency, low-intensity fire regime with a return interval of 1-4 yrs; historically, 10-30% of the forested area of the south was disturbed by fire each year. These natural fires tended to occur in the late spring and summer months when lightning was the primary cause of most fires in the region. Today, both non-industrial private and public landowners are increasingly interested in managing their natural pine forests for non-timber benefits, which often includes the incorporation of prescribed fire regimes. While research data on wildfire effects are relatively plentiful, we have little information on the effects of prescribed fire on C dynamics in southern pine forests, and so can provide little guidance or prediction of outcomes to natural resource managers interested in applying fire to natural pine stands. Therefore, the primary objective of this study was to quantify post-fire ecosystem C dynamics in a naturally regenerated pine stand in North Central Florida. • Results and Conclusions: • Prescribed Fire at ACMF • Prior to our initiation of eddy covariance research at the site in 2000, the ACMF stand was burned on an interval of 4-10 years. • Initial eddy covariance measurements at the ACMF forest determined that the system was a relatively small carbon sink, with annual net ecosystem production (NEP) about a fifth of that in surrounding plantation forests (Powell 2002). • Prior to our first experimental prescribed fire in 2003 (total of six years of understory vegetation development since the last prescribed fire) approximately half of the carbon, water, and energy fluxes could be attributed to the understory vegetation (Powell 2002, Powell et. al 2005, Powell et. al in review). • 2003 prescribed fire had a high intensity and approximately 98% of the understory carbon pool and vegetation were removed (Figure 2 and 4). • 2006 prescribed fire was less intense, with only 65% of the understory biomass removed (Figure 4). • Recovery of the understory carbon pools were very similar following both fires (Figure 4). • Understory carbon exchange patterns after prescribed fire were dynamic (Figure 4). In February, approximately one month after a prescribed fire treatment, understory C exchange was near neutral. By April, the understory was a net C sink, with light-saturated rates of understory C exchange (Figure 3). • Ecosystem carbon dynamics are buffered from fire and remain relatively constant (Table 1). • 2004 Flooding caused the largest alterations in ecosystem carbon dynamics, causing large decreases in GEP, proportionally larger decreases in Reco, and as a result, a doubling of NEP (Table 1). • Methods: • Study sites: • -41 ha, ~ 70 yr old naturally regenerated pine forest 15 km northeast of Gainesville, Alachua County, FL. • (29o44’N, 82o9’30” W). • - Prescribed fire applied the week of January 3, 2003 and 2006. • Eddy covariance • Carbon dioxide, latent energy, and sensible heat fluxes were measured for the understory and the entire ecosystem (Figure 1) using a closed path eddy covariance system (Clark et al., 1999, 2001, Powel et.al 2005, in review). • Data meeting the following criteria were filtered from the dataset: • U* <0.2 • incomplete half hours of data • Out of range data • Data which fall out of normality range for sonic wind vectors • Rain events within half hour data sets • Meteorological data • sensors: • Incident solar radiation (LI-200 pyranometer, Li-Cor, Inc., Lincoln, Nebraska) • photosynthetically active radiation (quantum sensor LI-190, Li-Cor, Inc.) • net radiation (#Q7, Radiation and Energy Balance Systems, Inc., Seattle, Washington) • wind speed and direction (R.M. Young 3001-5, Campbell Scientific, Logan Utah.) • temperature and relative humidity(ES-120, Omnidata International, Logan, Utah) • precipitation (tipping bucket, Sierra Misco, Inc., Berkely, California) • Soil energy storage was measured with three soil heat flux plates(HFT-3.1, Radiation and Energy Balance Systems, Inc.)buried 10 cm deep near the tower. • Water table depth was measured continuously with a Steven’s gage. • Biomass measurements: • - 4 permanent 50 m x 50 m plots. • - Random subplots were established in each permanent plot prior to burning, (n=4, 1x1 m). • - Baseline biomass harvest 1 wk prior to fire • - Post-fire harvests 1 wk following fire and every 3 months thereafter. • -Biomass separated to species level and dried for 72 hr @ 60o C and dry weights were determined. • -C/N ratios determined for each sample using Carlo Erba elemental analyzer. A Figure 3. Half-hourly net understory exchange of carbon one and three months post-fire (February and April, 2006, respectively). For clarity, a random 20% subsample of the data are plotted. The regression lines represent non-rectangular hyperbolic functions fitted through the data for the two time periods. B • Questions: • How does a program of low intensity, short return interval prescribed fire impact the cycling of C in natural pine forest in the SE Coastal Plain? • To what extent does a prescribed fire regime alter both tree and understory C sequestration and productivity. • What are the direct and indirect causes of change in the C dynamics of the system following fire? C D Figure 4. Time series of understory carbon content in response to two prescribed fire events indicated by arrows. E Figure 2. Austin Cary Memorial Forest prescribed fire treatment in January, 2003 (A-C), immediately post-fire (D), and six months post-fire (E). Overstory Fluxes Year NEP GEP Reco 2003 -166.378 -2023.17 1856.80 2004 -340.614 -1483.56 1142.94 Acknowledgments: We thank Ryan Atwood, Thomas Powell, Yarrow Titus, Miranda Funk, and Claudia Costagliola for assistance with data collection and management. We thank IFAS and the School of Forest Resources and Conservation for support and allowing us to conduct our research in the Austin Cary Memorial Forest. This research was supported by the Office of Science (BER), U.S. Department of Energy, through the SE Regional Center of the National Institute for Global Environmental Change under Cooperative Agreement No. DE-FC03-90ER61010. 2005 -169.442 -1798.07 1628.63 2006 -142.717 -1809.73 1667.02 Understory Fluxes Year NEP GEP Reco 2006 723.469 -998.086 1721.56 Figure 1. Understory and canopy eddy covariance towers at ACMF. Table 1. Annualpatterns of in GEP, Reco, and net ecosystem production (NEP) for canopy and understory. Carbon Dynamics of a Naturally Regenerated Florida Pine Forest when managed with Prescribed Fire Gregory Starr, Robert G. Gorman, Wendell P. Cropper, Jr., and Timothy A. Martin The University of Florida, School of Forest Resources and Conservation, Gainesville, Florida