Download
1 / 20
200 likes | 357 Views
understanding population trends and processes Small Research Grant: Oct 05 to Sep 07 ESRC RES-163-25-0012 for 2005-07 @ 40%. The micro-geography of UK demographic change 1991-2001 Paul Norman School of Geography, University of Leeds. The micro-geography of UK demographic change 1991-2001

E N D
understanding population trends and processes • Small Research Grant: Oct 05 to Sep 07 • ESRC RES-163-25-0012 for 2005-07 @ 40% The micro-geography of UK demographic change 1991-2001 Paul Norman School of Geography, University of Leeds
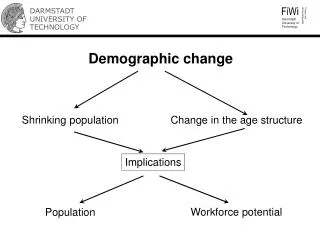
The micro-geography of UK demographic change 1991-2001 • Aim • Quantify, map & analyse changes in population size and social characteristics occurring in UK’s small geographical areas between the 1991 and 2001 Censuses • Population change • Which demographic components account for change? Balance between natural change & migration change • Is the population ageing evenly across space? • Area characteristics change • Are areas becoming more or less deprived over time? • Has health improved in areas now less deprived?
Technical challenges: consistency across UK & over time • 1991 & 2001 mid-year small area populations not comparable • To estimate a 1991 base population: • Adjust populations to mid-year & a consistent geography • Allow for changed view of 1991 Census undercount • To calculate area deprivation: • Create consistent variables by geography & definition • Ensure 1991 & 2001 measures are comparable • For ‘small areas’ • 7,958 wards in England, 881 wards in Wales • 1,010 postal sectors in Scotland, 582 wards in Northern Ireland
1991-2001 population change Population change Net migration Natural change
1991-2001 population change 1991 & 2001 Populations Change cf. natural change Change cf. net migration
Hierarchical Stratification Ward deprivation within area type • OPCS classification: districts • London • Metropolitan Cities • Non-Metropolitan Cities • Industrial Districts • Districts with New Towns • Resort, Port & Retirement • Accessible & Remoter Urban • Accessible & Remoter Rural • Deprivation: wards • Categorised into quintiles
1991-2001 population change Population change
1991-2001 components of change Population change
Are areas becoming more or less deprived over time? • Use of area characteristics measures • Cross-sectional research • Allocation of funding • Business marketing • Deprivation relationship with health • Time-series: deprivation measures • Are areas becoming more or less deprived over time? • Has health improved in areas now less deprived?
Classifying of areas • Problems when comparing areas at two or more time points • Input variables • Availability, definition and categorisation • Applicability over time • Geography • Boundary change • Method of classification • Applicability over time • Need to compare like with like & need consistency of information, geography & method • Official IMDs are time-point & country specific
Calculating comparable deprivation Townsend Index: comparable across UK & time Input variables for: c.10,400 small areas in both 1991 & 2001, deprivation relative to National 1991 & 2001 average Example area unemployment
2001 1991 Northern Ireland Northern Ireland England Wales Scotland England Wales Scotland Deprivation change Townsend scores: easing overall
Deprivation change Townsend Index: comparable across UK & time
Standardised Ratio Deprivation & mortality
Standardised Ratio Deprivation & LLTI
Standardised Ratio Deprivation change & mortality
Standardised Ratio Deprivation change & LLTI
Summary: change 1991-2001 • Population • In London, population gain in more deprived areas, due to natural change gain • Metropolitan areas natural change gain, but losing population due to net migration loss • Less deprived areas elsewhere growing, largely through net migration gain • Biggest growth in accessible urban & rural areas • Deprivation • Relative deprivation eased during the decade • Mortality & LLTI relate more strongly to deprivation than to larger area type with mortality improving over the decade • Generally, areas have better health when becoming less deprived
understanding population trends and processes • Small Research Grant: Oct 05 to Sep 07 • ESRC RES-163-25-0012 for 2005-07 @ 40% • UPTAP-related aspects • First funded research, managing this to ‘end of award’ • Networking & community • 3 UPTAP annual meetings; 11 presentations during & 6 after funding period • 1 paper published; 2 in revision; 2 in preparation; many ideas • UPTAP Research Findings (yep, one day, Stillers!), UPTAP book • Other researchers using data outputs (e.g. Champion, Dorling, Rowan, Adams) • Ongoing work on UPTAP(2) large grant