Download
1 / 48
710 likes | 1.39k Views
Precipitation Types. Global and Regional Mean Precipitation 1. Types of Precipitation: 2. Measurement:. FIT, Feb 15, 2012. Global Mean Precipitation. Satellite measurement of precipitation What happens in Hawaii?. Hawaii Mean Precipitation. Mean = 70 in Without land = 25 in.

E N D
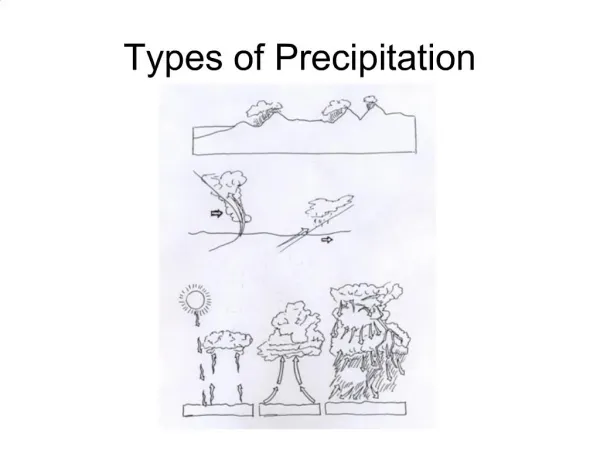
Precipitation Types Global and Regional Mean Precipitation 1. Types of Precipitation: 2. Measurement: FIT, Feb 15, 2012
Global Mean Precipitation Satellite measurement of precipitation What happens in Hawaii?
Hawaii Mean Precipitation Mean = 70 in Without land = 25 in Precipitation measurement by Rain Gauge
Hawaii (Feb 12, 2012, 0245 UTC) Radar measurement of rain
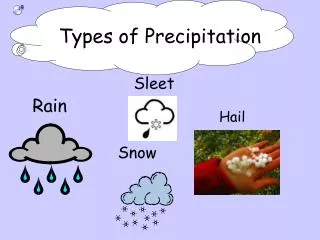
Precipitation Types • Drizzle: diameter < 0.5 mm • Rain: diameter >= 0.5 mm • Where are the raindrops larger, Miami or Seattle? • Raindrops almost always < 6 mm because • collision among raindrops • too large raindrops tend to break up • Start as rain, but may fall as drizzle. Does rain always reach the surface?
Does rain always reach the surface? • Falling precipitation that evaporate before reaching surface --- Virga • Low humidity - - evaporation - - drops become smaller - - rate of fall decreases • Strong updraft • Sudden rain shower and cloudburst (Cumuliform) • Rain and no-rain in places next to each other (Cumulonimbus) • Continuous rain at small vertical currents (layered cloud or Nimbostratus) How does “Virga” look like and where does it happen?
Virga (Rain not reaching the surface) Fig. 7-14, p. 174
Shape of Raindrops Spherical < 2 mm ; Parachute > 2 mm (surface area / volume) is minimum for 2. Fig. 2, p. 175
Intensity of Rainfall Table 7-2, p. 175
Snow c Falling ice-crystals and snowflakes (Fallstreaks) from cirrus clouds. Fig. 7-15, p. 176
Common forms of ice crystal Fig. 7-16, p. 176 Why is dendrite most common? Dendrite Fig. 7-17, p. 178
Why is dendrite most common? Growth = f(temperature, sat. vap. Pr. difference) Maximum growth rate is at -12 to -16 C, when saturation vapor pressure difference between water and ice is maximum. Table 7-3, p. 176
Intensity of Snowfall Is visibility the best way to measure snowfall? Can wind lead to visibility problem? Table 7-4, p. 178
Some more terms related to snowfall Flurries: light and intermittent from developing cumulus cloud Snow squall: brief but more intense than flurries, usually from cumuliform clouds Drifting snow: surface movement Blowing snow: in air movement Ground blizzard: after falling snow has ended Blanket of snow: snow covering the landscape Fig. 4, p. 179
Snow as Sound Absorbant Fig. 4, p. 179
Annual Average Snowfall over US Why is Hawaii not included? Fig. 7-18, p. 179
Snow in Hawaii !! Mauna Kea
Sleet and Freezing Rain Partially melted snowflake or cold raindrop - - freezes Deep freezing layer - - Sleet <= 5 mm Shallow freezing layer - - freezing rain >=0.5 mm Fig. 7-19, p. 180
Formation of Rime Supercooled droplets in contact with object at below freezing temperature - - white milky granular ice Fig. 7-20, p. 180
Destruction due to Freezing Rain Syracuse, New York, January 1998 Fig. 7-21, p. 180
Aircraft de-icing Fig. 5, p. 181
Average number freezing rain/drizzle days Fig. 7-22, p. 181
Vertical Temperature Profile and Precipitation Type Fig. 7-23, p. 182
Snow Grains and Snow Pellets Fig. 4, p. 179
Formation of Graupel / Snow Pellets gr Ice particle + cloud droplets -- rimed ice crystal -- graupel (dift shape than rime) -- snow pellet During summer: graupel - - large raindrop Vigorously convective cloud: graupel - - hailstones Fig. 7-24, p. 182
Formation of Hail/Hailstone Fig. 7-27, p. 183
Hail and Hailstone Dia = 17.8 cm (7 in) ; Circumference = 47.6 cm (18.7 in); weight > 1.75 lb Fig. 7-25, p. 182 Fig. 7-26, p. 183
Summary of Precipitation Types Table 7-5, p. 185
Measurement of Precipitation In-situ measurement: Rain gauge; accurate but spotty. Remote measurement: Radar, Satellite; not so accurate but large coverage. Combination of the above.
Components of the standard rain gauge Area of collector = 10 x area of measuring tube Fig. 7-29, p. 184
Tipping bucket rain gauge Fig. 7-30, p. 185
Transmitted energy backscatter Radar
Reflectivity Precipitation Oklahama, April 24, 1999 Fig. 7-31a, p. 187
Precipitation due to Fay (2008) Precipitation Reflectivity Fig. 7-31a, p. 187
Fig. 7-28a, p. 184 Fig. 7-28b, p. 184