Download
1 / 29
290 likes | 412 Views
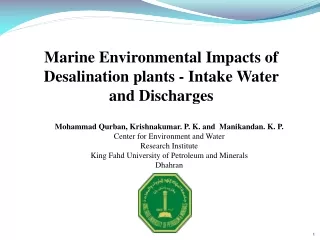
The need to quantify the loss of marine life in desalination plants. K.P. Manikandan, Mohammad A. Qurban, T.V . Joydas, M. Wafar and P.K . Krishnakumar. Introduction.

E N D
The need to quantify the loss of marine life in desalination plants K.P. Manikandan, Mohammad A. Qurban, T.V. Joydas, M. Wafar and P.K. Krishnakumar
Introduction • Desalination is being used in 150 countries around the world, providing some or all the daily water needs of an estimated 300 million people • There are now 16,000 desalination plants worldwide • Total production = 77.4 million cubic meters per day (m3/d) (24th IDA Worldwide Desalting Plant Inventory, 2012)
Introduction 76% Arabian Gulf 45% Mediterranean Sea 17% Red Sea 14% • 76% from three Seas
Production in Arabian Gulf • 45% of the global capacity
Production in Red sea • 14% of the global capacity
Introduction • Most desalination plants draw/pump water from the coastal waters • Coastal waters are the biologically productive zone • This is the zone where most marine animals prefer to lay eggs • As most marine larvae are passive swimmers (at the mercy of water currents) they are vulnerable to suction during the intake • Every year there is a huge loss of billions of aquatic organisms, including fishes, fish larvae and eggs, crustaceans, shellfish, and many other forms of aquatic life from the coastal ecosystems. • This huge loss will reflect on the declining fish landing and ultimately to the revenues generated by Fishery.
Definitions Impingement: Potential injuries or loss of marine organisms retained on the intake screens. (as per USEPA > 9.5mm) Entrainment: Loss of marine organisms which enter the desalination plant with the source Seawater (as per USEPA < 9.5mm) Entrapment: impacts associated with offshore intake structures connected to an on-shore intake screen and pump station via long conveyance pipeline – Trapped Adult fishes Fish and invertebrate larvae
Typical Larval Cycle 99.9% One Female 100,000 larvae 100 juveniles 98% 2 ADULTS
An example from Florida • Florida’s - Tampa Electric Company (TECO) Big Bend station, situated on Tampa Bay, at Apollo Beach. • Annually, impingement resulted in the loss of 419,286 “age 1” equivalent fish, and 11,113 pounds of fishery yield • Entrainment was far more lethal: 7.71 billion-age 1 equivalent fish were being decimated; 22.8 million pounds of lost fishery yield. • Most heavily hit were bay anchovies • Stone crabs, pink shrimp, sea trout, herring and black drum were also affected.
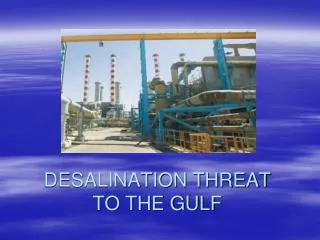
Loss due to Impingement & Entrainment in Arabian Gulf & Red Sea – Unknown ?
Objectives • To identify the methodology for quantifying the loss of marine organisms due to entrainment and impingement • To recommend mitigation measures by way of alternative modes of seawater intake
Assessment- Methodology • What to sample? • Limited to only large and late stage larvae (Fish & Crabs) • Phytoplankton to be ignored • Short generation times • Overly Abundant (bloom) can be a problem in quantification • Small Invertebrate Larvae & Fish Eggs ignored – Cannot be Enumerated
Assessment- Methodology • Sampling Locations: • From the Intake Screens (for Impingement) • In front of the Intake and at Water Body Locations using 300-μ mesh Plankton net (for Entrainment) • Two replicate tows were taken with a minimum target sample volume of 30 to 40 m3for each net on the bongo frame. • Sampling Frequency: • 12 to 18 Consecutive Months • Weekly – i.e., minimum of 52 Samples • 24-hr Sample Collection for Impingement • Day/Night Samples for Entrainment. • Four times per 24-hr period—once every six hours.
Assessment- Methodology • For Impingement Assessment - Adult & Juvenile Species trapped on the plant Screens are: • Identified/Classified • Counted and • Weighed • For Entrainment Assessment – Larval Species Collected on the 300-μ nets in front of the screens & in various areas of the Potential Impact Zone are: • Identified to the lowest taxonomic classification possible (e.g., genus or family level) and • Counted • Data Sets to be collected: • For Each sample day, Larval Counts & densities (No. per Unit Volume) at the Intake & in Water Body. • Actual Intake flows are measured at the time of sample collection.
Assessment- Methodology • Once species are identified and enumerated – the population and community levels effects caused by the removal needs to be estimated • Long term data not typically available • Models have to be used to estimate the potential effects of larval removal • Estimating the Larval mortality due to entrainment • Calculate the volume of water entering the intake (V) • Measure the concentration of larvae (no. per volume) that are entrained (N) • (assume 100% mortality) • Estimate Entrainment mortality = N x V
Assessment- Methodology • Models – two categories • Those that require life history data and those that do not
Assessment- Methodology • Requirements for demographic models • Fecundity • Age at first maturity • Longevity • Survival data for eggs, larvae and other stages through adults • Adult Equivalent Loss • Uses entrainment mortality in conjunction with larval sizes ( proxies for age) and natural mortality rates and estimate the Adult Equivalent loss • Fecundity Hindcasting • Uses entrainment mortality and back calculates the number of adult females that were lost (assuming 1:1 sex ratio or any other from literature)
Assessment- Methodology • In the absence of life history information, ETM models could be utilized • The ETM estimates conditional probability of mortality (PM) associated with entrainment • PM requires (PE - Proportional entrainment) as input which is calculated as : • Source water has to be defined based on hydrodynamic and biological characteristics of the water body • Calculation of No. of days when larvae are at risk (d): • Estimate the age of the fish based on the average size entrained – for eg., 23 days • So, for 365 days = 365/23 = 16 days at risk(d) • Calculation of proportion of larvae that will escape entrainment (Pesc) : (1- PE )d • Proportional mortality (PM) = 1/d (1-Pesc)
Assessment- Methodology • Estimation of Habitat Production Foregone or Area Production Foregone • HPF = Proportional mortality (PM) x Source water body (SWB) • An example from Carlsbad Desalination study • So, HPF = 37 acres for 304 Million gallons per day in Carlsburg
Assessment- Methodology • 37 acres of new bay habitat if restored to the system will reduce the impacts caused due to impingement and entrainment- assuming that new bay habitat was a comparable mixture of habitats to that in source water body • Scale and context of HPF are very important • Two fishes have estimated entrainment losses (PM) of 1% • – Case 1: northern anchovy has estimated source water of 1,000 km2, results in HPF =10 km2 – meaningless in a context as no habitat dependency for anchovy spawning • – Case 2: kelp bass occupying kelp habitat around intake of 1 km2, results in • HPF = 0.01 km2– could be of greater concern if kelp habitat limited in area of intakes • Mitigation could be by way of creating a coastal habitat similar to that of source water body, which will provide measurable long term environmental benefits
Mitigation measures Sand Filtration
Mitigation measures Wedge Screens
Mitigation measures Subsurface intakes Vertical beach well Radial intake well
Mitigation measures Slant wells
Mitigation measures Horizontally directed drains (HDD) wells
Mitigation measures Marine Life Exclusion System
Conclusion • The current US EPA standard requires that the best available technology should be used in order to achieve impingement reduction of 85-95% and entrainment reduction of 60-90% • Middle east has the maximum number of desalination plants, but unfortunately, no estimate of loss due to entrainment and impingement in the Middle east • There is an immediate need to assess the impacts of entrainment and impingement in the Middle east • Only by quantifying the impact, measures could be taken to minimize the loss