Download
1 / 29
300 likes | 441 Views
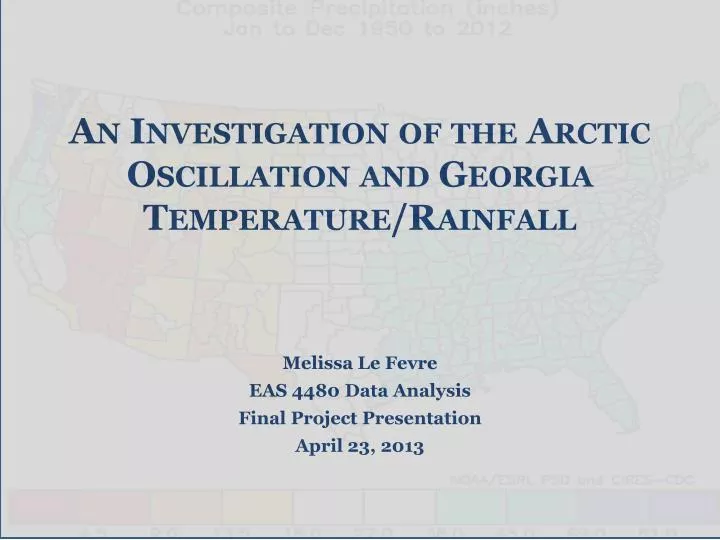
An Investigation of the Arctic Oscillation and Georgia Temperature/Rainfall. Melissa Le Fevre EAS 4480 Data Analysis Final Project Presentation April 23, 2013. PRESENTATION OVERVIEW. Arctic Oscillation Introduction Motivation Source of data Class Correlation Statistical analysis

E N D
An Investigation of the Arctic Oscillation and Georgia Temperature/Rainfall Melissa Le Fevre EAS 4480 Data Analysis Final Project Presentation April 23, 2013
PRESENTATION OVERVIEW • Arctic Oscillation Introduction • Motivation • Source of data • Class Correlation • Statistical analysis • Univariate statistics • Bivariate statistics • Time series analysis • Facts and Figures • Conclusions • Future Work CPC, 2013
ARCTIC OSCILLATION BASICS • Distribution of pressure patterns over Arctic region and NH mid-latitudes • “AO flips” = fundamental changes in wind direction • Significant player in climate variability (Higgins et. al 2001) • Large variance in surface air temperatures NSIDC, 2013
THE ARCTIC OSCILLATION • Positive phase – cool air constricted • Negative pressure anomalies over Arctic • Positive pressure anomalies over mid-latitudes • Negative phase – weakening of the winds • Positive pressure anomalies over Arctic • Negative pressure anomalies over mid-latitudes • Weathering AO Weather • Positive phase means warmer and drier conditions for U.S. • Negative phase – jet moves south, winter weather tags along NSIDC, 2013
AO INDEX • EOF applied to monthly 1000hPa mean height anomalies • Poleward of 20° latitude • Max explained variance • For the period: 1979-2000 • Loading pattern: • “First leading mode from EOF analysis” • Observations occur 1000hPa • Capture cold season patterns CPC, 2013
MOTIVATION NCDC, 2013
HYPOTHESIS • AO and winter temperatures: significant correlation • Strongest in December • AO and winter rainfall: mediocre correlation • Georgia temperatures: lag behind AO • Georgia rainfall: lag behind AO • Datasets normally distributed • Pass test
CLASS CORRELATION • Analysis from both parts of class • 1950-2012 annual, DJF and individual winter month analysis • Statistical Analysis • Statistics • Test • Correlation coefficients • Least-squares regression and error • Time Series Analysis • Periodogram • Cross-spectral density • Lag/phase values • Coherence
STATISTICAL ANALYSIS • Monthly analysis of DJF AO, temperature and rainfall data • Monthly skewness, kurtosis • Chi-squared test on individual month’s variables • Monthly correlation coefficients and significance, 95% confidence interval • Total DJF least-squares regression and correlation coefficients
1950-2012 DJF GA Temperature 1950-2012 DJF GA Rainfall 1950-2012 DJF AO Index Values
DJF AO INDEX CHI-SQUARED PROBABILITY DENSITY FUNCTION February value Critical value January value December value
DJF GEORGIA TEMPERATURE CHI-SQUARED PROBABILITY DENSITY FUNCTION January value February value Critical value December value
DJF GEORGIA RAINFALL CHI-SQUARED PROBABILITY DENSITY FUNCTION February value Critical value January value December value
TIME SERIES ANALYSIS • Least-squares regression: • Georgia monthly temperature data (1950-2012) • Georgia monthly rainfall data (1950-2012) • Least-squares regression error: • AO Indices-Georgia Temperature • AO Indices-Georgia Rainfall • Periodogram • Cross-spectral density • Lags • Phase values • Coherence • Correlation coefficients
AO PERIODOGRAM TEMPERATURE PERIODOGRAM
AO PERIODOGRAM RAINFALL PERIODOGRAM
CONCLUSIONS • There is a significant correlation between the AO index and Georgia temperatures • Observed to be strongest in December (through correlation coefficient) • Little to no correlation between rainfall and AO • Georgia temperatures lag only slightly behind the AO index • Rainfall lags about 2.5 months • Overall, little correlation between annual temperatures and annual AO indices • Correlation does not mean causation
FUTURE WORK • Apply methods to data from the entire U.S. • See regional biases/consistencies • Study years with severe winter storms in the Southeast • Years with strongest negative AO values? • Investigate other teleconnections
REFERENCES • CPC, cited 2013: Arctic Oscillation (AO). [Available online at http://www.cpc.ncep.noaa.gov/products/precip/CWlink/daily_ao_index/ao.shtml.]. • Higgins, R.W., Leetmaa, A. and Kousky, V.E., 2001: Relationships between Climate Variability and Winter Temperature Extremes in the United States. Journal of Climate.,15, 1555-1572. • NCDC, cited 2013: Monthly Mean AO index since January 1950. [Available online at http://www.cpc.ncep.noaa.gov/products/precip/CWlink/daily_ao_index/monthly.ao.index.b50.current.ascii.table.]. • SERC, cited 2013: Georgia State Averaged Precipitation Data. [Available online at http://www.sercc.com/climateinfo_files/monthly/Georgia_prcp.html.]. • SERC, cited 2013: Georgia State Averaged Temperature Data. [Available online at http://www.sercc.com/climateinfo_files/monthly/Georgia_temp.html.]. Websites Used for Images • http://nsidc.org/icelights/2012/02/02/the-arctic-oscillation-winter-storms-and-sea-ice/ • http://www.cpc.ncep.noaa.gov/products/precip/CWlink/daily_ao_index/ao.loading.shtml • http://www.cpc.ncep.noaa.gov/products/precip/CWlink/daily_ao_index/ao_index.html • http://www.ncdc.noaa.gov/ • http://www.cpc.ncep.noaa.gov/products/precip/CWlink/daily_ao_index/history/method.shtml • http://www.ncdc.noaa.gov/cag/ • http://www1.ncdc.noaa.gov/pub/data/cmb/teleconnections/ao-5-pg.gif