Download
1 / 15
150 likes | 157 Views
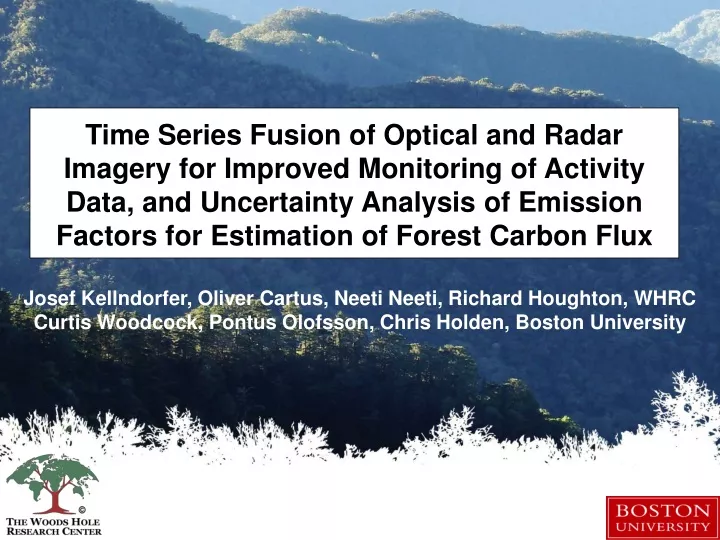
Time Series Fusion of Optical and Radar Imagery for Improved Monitoring of Activity Data, and Uncertainty Analysis of Emission Factors for Estimation of Forest Carbon Flux. Josef Kellndorfer, Oliver Cartus, Neeti Neeti, Richard Houghton, WHRC

E N D
Time Series Fusion of Optical and Radar Imagery for Improved Monitoring of Activity Data, and Uncertainty Analysis of Emission Factors for Estimation of Forest Carbon Flux Josef Kellndorfer, Oliver Cartus, Neeti Neeti, Richard Houghton, WHRC Curtis Woodcock, Pontus Olofsson, Chris Holden, Boston University
Objectives • Objective (1) – Develop a Novel Method for the Generation of Activity Data • Develop an algorithm from optical and radar time series fusion to produce the most accurate assessment of deforestation, forest degradation, and forest regrowth area estimates at annual time steps or better (i.e., activity data). • Implement good practices for assessing uncertainty and accuracy of activity data (Olofsson et al. 2014, 2013). • Objective (2) – Uncertainty Analysis of Carbon Emission Estimates from Activity Data and various Sources for Emission Factors • Compile a database of country specific emission factors stratified by land cover categories linked with carbon density estimates from forest inventory and existing biomass maps. • Study impact of uncertainties in activity data and emission factors on estimated carbon flux from a bookkeeping model in order to provide guidance to national MRV implementation.
Study Area Mexico: High priority sites for CONAFOR/PMN datasets: RapidEye (manual interpretation), ortho-photo, Peru/Colombia: GEO-FCT sites datasets: UAVSAR, RapidEye, other high-res data Field campaigns
Landsat Time Series Modeling Time series modeled as series of cosine/sine functions: Change Criterion Zhu et al. (2013, 2014, RSE)
Change detection with radar Landsat like time series modeling for PALSAR is not feasible because: 1) limited number of acquisitions available (in one season) 2) radar backscatter change due to changes in imaging conditions tends to be of stochastic nature The Irish weather stone: if it is wet, it is raining Bi-temporal change detection approaches have been used large-scale (e.g., Santoro et al. 2012) Trends can be identified
PALSAR Change Detection Algorithm: 1. PALSAR FBD pre-processing in WHIPS 2. Multi-temporal filtering 3. Log-Ratio calculation for all image pairs in a time series 4. Automated threshold determination for identifying areas with backscatter in- and decreases (Kittler-Illingworth Criteria) 5. Linear image normalization to account for changes in environmental imaging conditions 6. Markov-Random-Field post-classification considering spatial context to improve boundaries of areas identified as “changed”(Pantze et al. 2014) Multiple Iterations
HV log ratio 08-2007 09-2010
Threshold Selection and Normalization Compensate for differing imaging conditions
Change Map • Backscatter change can be a consequence of: • 1) actual land cover/use • change • 2) soil moisture dynamics • 3) agriculture, … • Multi-temporal stack of images can help to identify areas for which land cover hasn’t changed • Is the change persistent ? • Initial results show that number of PALSAR images is not always sufficient L-HV decrease L-HV increase Red – change persistent
Summary and Outlook • In many areas, Landsat provides dense time series with detailed information on land cover change/degradation • The addition of radar imagery in these areas may be of use to compliment and extend (e.g., improved timing of change) the information already present in the Landsat timeseries • Initial results show limitations of both, optical and radar, when used alone • Limitations of CCDC due to persistent cloud cover (Colombia) • L-HV backscatter change not only related to land cover change • acquisition strategy of PALSAR not ideal to identify persistent change in land cover/use (single season, few annual observations) • In parts of Colombia, the addition of radar is crucial (but is it sufficient?) • Outlook: • Field trips in 2015 to Colombia/Peru – recent degradation/deforestation/conversion • Validation in Mexico alongside national Landsat/RapidEye change products for Mexico’s MRV