Download
1 / 40
400 likes | 536 Views
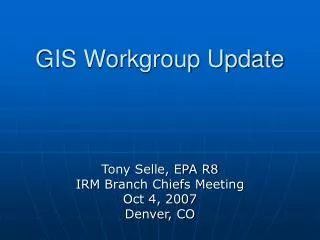
USEPA GIS Workgroup Fall 2004. Daniel T. Heggem Acting Branch Chief, LEB Research Physical Scientist Environmental Sciences Division Landscape Ecology Branch September 14, 2004. The four letters that strike FEAR into the faint of heart. EMAP-WEST.

E N D
USEPAGIS WorkgroupFall 2004 Daniel T. Heggem Acting Branch Chief, LEB Research Physical Scientist Environmental Sciences Division Landscape Ecology Branch September 14, 2004
EMAP-WEST The purpose of EMAP-West is to demonstrate the value of the EMAP approach by applying it to environmental problems across a large and diverse geographical region, and to advance the science of ecosystem monitoring. This will be accomplished by applying EMAP designs to urgent and practical problems facing the western EPA Regional Offices.
EMAP-West SW • The purposes of the Surface Waters component are to: • Describe the current ecological condition of flowing waters of the West. • Build a database for the long-term monitoring of the West. • Develop methodologies to advance the science of understanding the ecological function of western ecosystems and the relation of human influence. • Work with the states and others to build a strong program of ecological monitoring that will lead to better management and protection of the waters of the West.
EMAP-West Coastal
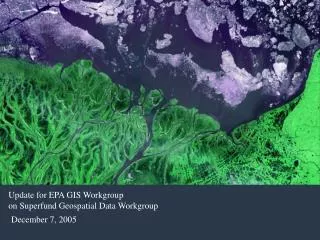
EMAP - West Recent Additions | Contact Us | Print VersionSearch: EPA Home > EMAP > West > Data Browsers Home Overview Presentations Components Documents Data Browsers Contacts EMAP Home EMAP-West Data Browsers The Environmental Monitoring and Assessment Program (EMAP) is conducting a pilot study in the western United States. This study will advance the science of ecological monitoring and demonstrate techniques for regional-scale assessment of the condition of aquatic resources in the 14 western states in EPA Regions 8, 9, and 10 (shown below). The EMAP-West Data Browsers are a demonstration of a versatile communication device for our landscape ecological assessment products, reports, assessments, data studies, and analysis tools. The EMAP-West Data Browsers allow the user to view and download the geodata used in the pilot study area landscape assessments, as well as landscape metrics examples created with ATtILA v3.0 (Analytical Tool Interface for Landscape Assessments, ArcView 3.x extension). To view the individual EMAP-West Data Browsers, click on the map pilot study areas or text / thumbnail links below. To return to the EMAP-West Data Browsers page, click on the "EMAP - WEST PILOT STUDY AREA" text in the background image at the top of the Data Browser or use your Internet browser "Back" button. NOTE:The EMAP-West Data Browsers are not within the new EPA template and cannot be displayed as "text only" or within Internet browsers that do not support frames and JavaScript.
The data are available for our stakeholders for: General information landscape condition. TMDL development and implementation Monitoring design and planning Citizen involvement – what is in my backyard?
Now you have the data you need to start your landscape analysis.
Association work for the water quality parameter of dissolved solids. Dan Heggem and Anne Neale.
This is a fit analysis in SAS interactive analysis using the square of the mean of the dissolved solid data (transformed) with the Riparian Forest 0 Landscape metric.
Results of the SAS guided analysis for the same data. Log mean instead of square mean.
Back to ARC View to calculate our regression model. New field: DS_Pred
Dissolved Solids = (19.0414 – (0.1188*Rfor0)) 2 Calculated values.
Show the results here using the reporting units of 10 Digit HUCs.
Exact same approach and method – different area and reporting units = 1 x 1 kilometer Southern California
% Forest Riparian 0 to 100 %
Predicted Sediment Dissolved Solids mg/l (22.2056-(0.1717*Rfor0)sqr Rsq = .81
% Rfor0 Stream Grid on Map Unit
Predicted Sed mg\l 25 - 493 Stream Grid on Map Unit
Predicted Sed mg/l 25 - 493