Download
1 / 12
120 likes | 248 Views
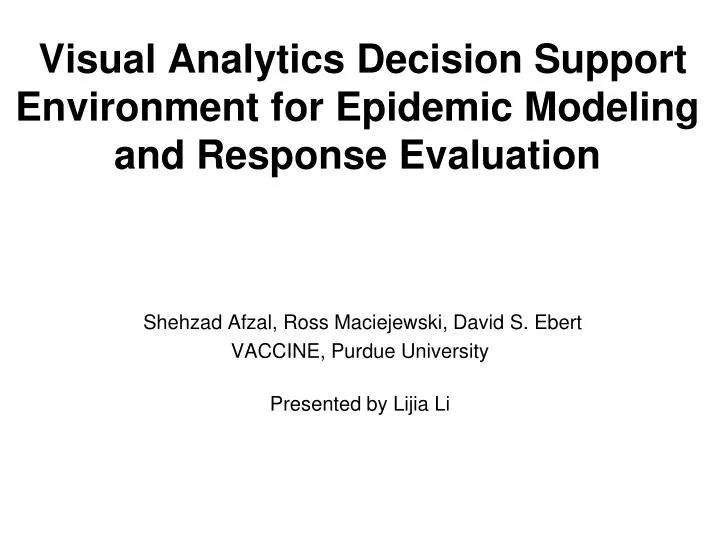
Visual Analytics Decision Support Environment for Epidemic Modeling and Response Evaluation. Shehzad Afzal, Ross Maciejewski, David S. Ebert VACCINE, Purdue University Presented by Lijia Li. Problems:.

E N D
Visual Analytics Decision Support Environment for Epidemic Modeling and Response Evaluation Shehzad Afzal, Ross Maciejewski, David S. Ebert VACCINE, Purdue University Presented by Lijia Li
Problems: • Public health officials must prepare and exercise complex plans in order to deal with potential mass casualty events like epidemic outbreaks • Officials often rely on information and trends provided via complex modeling • Such plans are often developed with only a few specific scenarios in mind • Absence of decision support tools makes it difficult to analyze the future course of such events, evaluate potential mitigation strategies and find the optimal plan to deal with such catastrophic events
Contribution Developed an Interactive Decision Support Environment in which analysts can: • Explore epidemic models and their impact • Interactively utilize mitigative response measures and observe the impact over time under varying scenarios • Utilize doubly linked decision history visualization and navigation tools that can link to multiple simulation runs and provide simultaneous comparison of mortality and infection rates • Design an optimal mitigative response strategy for a given scenario
Main Views of the Decision Support Environment Spatiotemporal Model View Showing epidemic spread at Day 214 Decision History Visualization & Navigation View
Decision History Visualization and Navigation • Each path in the decision history view represents a simulation run • For each path, cumulative sum of the overall magnitude of the outbreak (in terms of lives lost etc.) is calculated • Baseline represents the ‘cumulative summation of lives on day t of the scenario’ in absence of any mitigative measure • Other paths branch off from this baseline such that the decision history
Case Study –Rift Valley Fever Description: Epidemiological spread model that utilizes a differential equation model and simulates the spread of rift valley fever through a simulated mosquito(Aedes & Culex) and cattle population in Texas2 Mitigative Response Measures: • 1)Pesticides (kill Aedes and Culex Mosquito population) • 2)Quarantine (Block transport of cattle into or out of the selected region)
Case Study –Rift Valley Fever Spatiotemporal view showing effects of utilizing both the quarantine and pesticides (mitigative measures) at Day 90 Spread Situation at Day 229 Spread Situation at Day 153 Both Quarantine and Pesticides applied at Day 90
Case Study –Rift Valley Fever Best Decision Path D3 is Identified Pesticides AedesPesticides Culex Quarantine D1 140,260 260 80 D2 200 120,200 - D3 150,190 320 20 D4 200, 240 240, 290 - D5 240,290,305 240,290,305 Summary of Decision Paths
Conclusion and Future Work • Decision History Visualization and Navigational support helps users analyze and compare multiple simulation paths and identify optimal combination of mitigative response measures • Architecture of the system supports easy integration with other epidemiological models • In future, they will explore the inclusion of economic model into the system that might help visualize the impacts of epidemic spread on local economy
Q & A THANK YOU
Architecture Diagram Caches tablets locations Register servers Write and Read data Manage tablet server