Download
1 / 14
140 likes | 276 Views
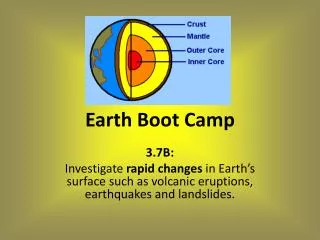
Scientist Boot Camp. Engaging in Scientific Inquiry. Goals of Boot Camp. To Become Proficient In…. Scientific questioning Writing a hypothesis Procedural development Table construction/organization Graphing skills Data analysis Writing a “Power” conclusion. Homeostasis.

E N D
Scientist Boot Camp Engaging in Scientific Inquiry
Goals of Boot Camp To Become Proficient In…. • Scientific questioning • Writing a hypothesis • Procedural development • Table construction/organization • Graphing skills • Data analysis • Writing a “Power” conclusion
Homeostasis • Maintaining relatively constant internal environmental conditions even in a changing system.
A good scientific question… • Answers something new • Is based on/builds upon previous research/knowledge • Is practical • Is simple • Is specific • Furthers current scientific understandings
A Hypothesis… • Is a tentative answer to a well developed question • MUST be testable! • Gains credibility by surviving MULTIPLE attempts to falsify them • “If….then…because” • Writing your hypotheses in this format will help you • Identify your independent and dependent variables • Focus on the reasoning for the claim you are making
Designing an Experiment • Only one variable should be tested at a time • Attempt to either control or minimize the impact of all other variables • Identify the following within the experiment: • Experimental/independent/manipulated variable • Dependent/responding variable • Experimental group(s) • Control group(s) • Control variables
Tables Use a table to… • Present lists of numbers or text in columns/rows • Tables should be numbered and have a title • Each column/row should have a label DO NOT use a table to… • Show a trend or a relationship between sets of data Table 1: Male & Female Color Preference
Graphs Use a graph to… • Show a trend or a relationship between sets of data • Graphs should be numbered (Figure 1, 2, etc.) and have a title • The graph’s title should describe what data is being displayed • Both X and Y-axis should have a label and include units • Provide a key if appropriate
Graphs Bar Graphs… • Compare things between different groups. Line Graphs… • Track local changes from one point to another. Figure 1: Trash on the Beach: Type and Amount Total Figure 2: Absorption Spectrum of Spinach Chlorophyll Extract Number of Pieces
Graphs Scatter Plots… • Show how much one variable is affected by another. • The relationship between the two variables is called their coorelation. Figure 3: Frequency and Duration of Old Faithful Eruptions
Data Analysis • Identify the overall trends/patterns displayed on your graph • What is the overall change/difference? • How do averages compare? • What are the slopes/rates of lines? Figure 4: Reaction rate over time with and without enzymes
A Great Conclusion… • Refers back to the prediction/hypothesis • If your data does not support your hypothesis this does NOT mean that your data is bad, or that your experiment was a failure! • Answers the question/reflects on hypothesis • Refers to the collected data • Trends/patterns (averages, slope/rate, overall change) • Explains WHY you obtained the results you did • This should include a scientific explanation! • Analyzes possible sources of error • Identify at least one source of error & explain how this impacted data. • Propose an improvement that eliminates/minimizes error & predict the effect of the correction on new data. • Identifies possible future research • Should be related to/extend this study in some way.