Download
1 / 8
80 likes | 217 Views
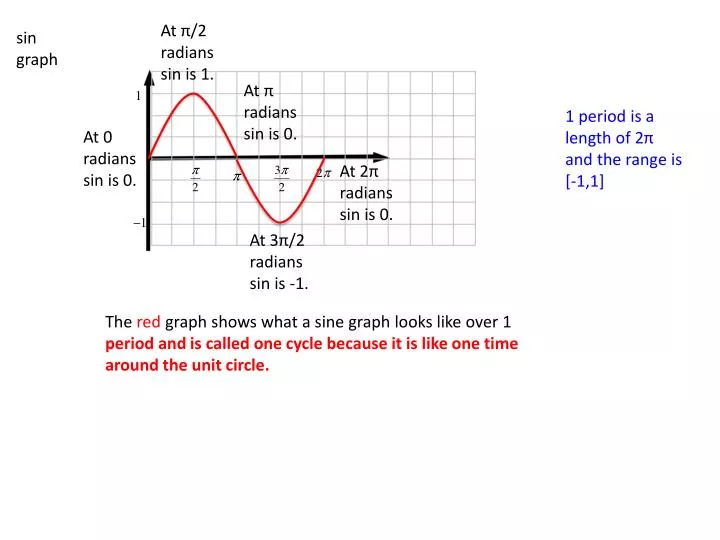
At π/2 radians sin is 1. sin graph. At π radians sin is 0. 1 period is a length of 2π and the range is [-1,1]. At 0 radians sin is 0. At 2π radians sin is 0. At 3π/2 radians sin is -1.

E N D
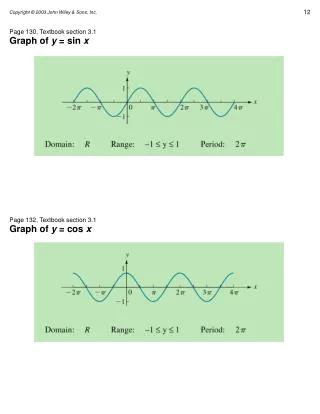
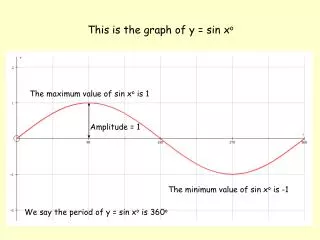
At π/2 radians sin is 1. sin graph At π radians sin is 0. 1 period is a length of 2π and the range is [-1,1] At 0 radians sin is 0. At 2π radians sin is 0. At 3π/2 radians sin is -1. The red graph shows what a sine graph looks like over 1 period and is called one cycle because it is like one time around the unit circle.
At π/2 radians cscis 1. csc graph At π radians cscis undef. 1 period is a length of 2π and the range is (-∞,-1]u[1,∞) At 0 radians cscis undef. At 2π radians cscis undef. At 3π/2 radians cscis -1. The red graph shows what a cscgraph looks like over 1 period and is called one cycle because it is like one time around the unit circle. The period is still 2π but starting at 0 and every π there is an asymptote.
At 2π radians cos is 1. Cosine graph What will this look like? At 0 radians cos is 1. At π/2 radians cos is 0. 1 period is a length of 2π and the range is [-1,1] At 3π/2 radians cos is 0. At π radians cos is -1. The red graph shows what a cos graph looks like over 1 period and is called one cycle because it is like one time around the unit circle.
At 2π radians cos is 1. secgraph What will this look like? At π/2 radians sec is undef. At 0 radians secis 1. 1 period is a length of 2π and the range is (-∞,-1]u[1,∞) At 3π/2 radians secis undef. At π radians secis -1. The red graph shows what a secgraph looks like over 1 period and is called one cycle because it is like one time around the unit circle. The period is still 2π but starting at π/2 and every π fromthere is an asymptote
y x tan graph 1 period is a length of π and the range is (-∞,∞) The red graph shows what a tangraph looks like over 1 period and is called one cycle because it is like one time around the unit circle. The period is π and there is an asymptote at π/2 and every π from there.
y x tan graph 1 period is a length of π and the range is (-∞,∞) The red graph shows what a cot graph looks like over 1 period and is called one cycle because it is like one time around the unit circle. The period is π and there is an asymptote at 0and every π from there.
Now that we know what the basic graphs look like now we can determine what effects the graphs to do this we will look at the equations: y = d + a tan(bx – c) y = d + a csc(bx – c) And y = d + a cot(bx – c) y = d + a sec(bx – c) In the basic function d = 0, a = 1, b = 1 and c = 0 The only thing that is different from the sine and cosine besides the way the graph looks is that tan and cot have a period of π so the ending value of the period = π