Download
1 / 59
650 likes | 1.56k Views
THE WORLD OIL MARKET. Where does our oil come from? How much of it do we use? How much of it do we produce? Who controls the world oil market? How are prices set?. To paraphrase Will Rogers:. “Buy land (oil)—they ain’t making any more of it.”.

E N D
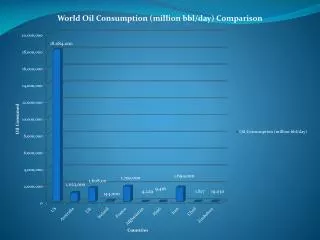
THE WORLD OIL MARKET • Where does our oil come from? • How much of it do we use? • How much of it do we produce? • Who controls the world oil market? • How are prices set?
To paraphrase Will Rogers: “Buy land (oil)—they ain’t making any more of it.”
TEN MAJOR OIL EXPORTERS: 1991 and 2000(1,000 BARRELS PER DAY)
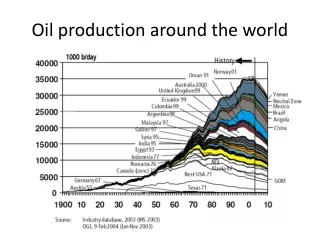
OPEC AND NON-OPEC The members of the Organization of Petroleum Exporting Countries (OPEC) are: Algeria, Indonesia, Iran, Iraq, Kuwait, Libya, Nigeria, Qatar, Saudi Arabia, United Arab Emirates, and Venezuela. In addition, seven countries produce more than 2 million barrels per day yet are not part of OPEC. These are: the U.S. (the world's largest total oil producer for 2001), Russia, Mexico, China, Canada, Norway, and the United Kingdom (Britain).
And how much will drilling in the Arctic National Wildlife Refuge Help us with our importing of oil? Let’s take a look
Average Gas Prices: 2000(U.S. Dollars per Gallon) Japan—the world’s second largest per capita importer of oil. U.S.—the world’s largest per capita importer of oil
The next slide shows the price history of crude oil and gasoline. To grasp the significance of this we need to understand the difference between REAL prices and NOMINAL price
TIME SERIES OF CRUDE OIL AND GASOLINE COSTS CRUDE OIL COSTS GASOLINE COSTS
The purpose in calculating “real” prices is to be able to compare what something costs today with what it cost several years ago when incomes and general prices were different from what they are today.Recall that the income of working people tends to rise a little each year reflecting the need to “keep up” with inflation (the fact that costs rise a little each year).Why do costs rise a little each year? Perhaps some raw material is getting a bit more scarce and it now costs more to acquire it.Perhaps urban growth is driving up the price of land so that rents increase.
Inflation represents an increase in the general level of prices, or, to say the same thing, it is a general decrease in the value (the purchasing power) of an amount of money. Deflation means that the general price level is falling. The U.S. government (Labor Department) calculates the Consumer Price Index (CPI) by conducting monthly surveys of retail prices across the country. The CPI measures the cost of a standard “market basket” of goods and services.
Suppose the market basket contains only 3 goods (A, B, and C). In year 1 the cost of the market basket is $5.00. In the second year, two prices have risen and one has declined. Yet we see that the price level has risen because the cost of the market basket has risen to $5.50. This is an increase of 10% (50/500 = 10%). In year 3 prices are again higher, and the cost of the market basket goes up by another $0.50. Now the general price level is 20% higher than it was in year 1 ([600 - 500]/500 = 20%), and 9.1% higher than in year 2 ([600 - 550]/550 = 9.1%).
To compute the price index, the cost of the market basket in any period is divided by the cost of the market basket in the base period, and the result is multiplied by 100. In the table above, year 1 is the base year. The price index for year 3 is: Price Index = (P3/Pb) x 100 = (6.00/5.00) x100 = 120.00 Notice that some prices may actually be declining while the price index is rising. These prices were not ignored by the price index; rather their contribution was less important to the overall result than the contribution of items whose prices rose. When we talk of the real price of something in year 3 compared to year 1 we need to correct it for the inflation depicted in the example. Assume that gasoline in year 1 costs $2.00 per gallon, and $2.10 in year 3. Has the real price of gasoline gone up or down? For this we use the CPI calculated above.
We can look at it in two ways. In year 1, $2.00 x 120 = $2.40 implying that gasoline would, if it went up in price at the same rate as other prices increased, now cost $2.40. However, since it now costs only $2.10 per gallon its price in REAL terms has fallen, even though its nominal price has risen ($2.00 $2.10 < $2.40). Or, we could consider its current price of $2.10 and ask what its price in year 1 would have been if it were corrected for inflation from its current price going back in time (back to year 1). Here we consider $2.10/120 = $1.75. Since this is clearly less than what gasoline actually cost in year 1 ($2.00), we see again that gasoline prices have NOT been increasing as fast as the level of all prices.
WHAT ABOUT STATE & LOCAL GASOLINE TAXES: 2001 2005 in WISCONSIN: 29.9 cents + 3 cents “environmental tax” = 32.9 cents.
WHAT ABOUT FEDERAL GASOLINE TAXES? NOW 18.4 CENTS
What is in A Barrel of Crude Oil? Products Gallons per barrel • Gasoline 19.5 • Distillate fuel oil(Includes both home heating oil and diesel fuel) 9.2 • Kerosene-type jet fuel 4.1 • Residual fuel oil(Heavy oils used as fuels in industry, marine transportation and for electric power generation) 2.3 • Liquefied refinery gasses 1.9 • Still gas 1.9 • Coke 1.8 • Asphalt and road oil 1.3 • Petrochemical feedstock's (primarily for plastics) 1.2 • Lubricants 0.5 • Kerosene 0.2 • Other 0.3 Figures are based on 1995 average yields for U.S. refineries. One barrel contains 42 gallons of crude oil. The total volume of products made is 2.2 gallons greater than the original 42 gallons of crude oil. This represents "processing gain."
The Crude Economics of Crude Oil • Notice that a barrel of oil costing $30 will yield approximately 20 gallons of gasoline and 22 gallons of other products. • A rough calculation would suggest that this implies a cost of $15 for 21 gallons of crude oil that will yield 20 gallons of gasoline • That is approximately $0.71 per gallon. Of course there are processing costs required to bring forth that 20 gallons of gasoline, and then transportation costs to get it to your corner gas station (or PDQ store…..) • At the moment (March 27, 2003), crude oil prices are hovering around $28 per barrel.
TEN HIGHEST NATIONS IN PER CAPITA CONSUMPTION OF OIL (BARRELS PER YEAR)
THE TEN LARGEST OIL IMPORTERS: 1991 and 2000(1,000 BARRELS PER DAY)
Legend to Figure of World Oil Prices: 1970 - 2000 #4 Arab oil embargo begins (October 19-20, 1973) #6 Arab oil embargo ends (March 18, 1974) #17 Iran takes hostages; President Carter halts imports from Iran; Iran cancels US contracts; Non-OPEC output hits 17.0 million b/d #23 First major fighting in Iran-Iraq War #40 Exxon's Valdez tanker spills 11 million gallons of crude oil #42 Iraq invades Kuwait Oil embargo ends (March 18, 1974) #43 Operation Desert Storm begins; 17.3 million barrels of SPR crude oil sales is awarded #44 Persian Gulf war ends #51 Extremely cold weather in the US and Europe #59 Oil prices triple between January 1999 and September 2000 due to strong world oil demand, OPEC oil production cutbacks, and other factors, including weather and low oil stock levels. #60 President Clinton authorizes the release of 30 million barrels of oil from the Strategic Petroleum Reserve (SPR) over 30 days to bolster oil supplies, particularly heating oil in the Northeast.
The Economics of World Oil Markets • The world oil market is assumed to have several (many) suppliers and several (many) buyers. • This condition gives us the sort of diagram shown below:
THE INTERNATIONAL OIL MARKET $ PW XS MD QW QUANTITY
This figure depicts a “somewhat competitive” situation in which more oil can be sold on the world market only if suppliers are willing to lower their price. And of course this would require some change since they are now unwilling to sell more oil unless the price is higher than at present (notice this from the existing supply curve XS).
The existence of OPEC means that eleven of the world’s major oil producers are united in efforts to control production in the interest of controlling price. Recall that the members of OPEC are Algeria, Indonesia, Iran, Iraq, Kuwait, Libya, Nigeria, Qatar, Saudi Arabia, United Arab Emirates, and Venezuela.
How Does OPEC influence world oil prices? • It does so by controlling the production and sale of oil by its members. • That is, the OPEC Ministers meet regularly to coordinate exactly how much oil in total, and also how much from each of the eleven countries, will be offered for sale over the coming 3-4 months.
We have here the world demand for oil at various prices—lower prices leading to greater total oil sales, and higher prices having the opposite effect. Now consider the OPEC suppliers. They wish to shift the supply curve UP thereby restricting supply and thus raising prices from PW to POPEC. SOPEC $ POPEC PW XS DW QOPEC QW Quantity of Oil
Notice that the action to restrict production and thus crude oil coming onto world markets does indeed give them a higher price. They are able to maintain this happy situation only by imposing strict compliance on the part of their 11 members.
Holding Together A Cartel • The most difficult challenge is to keep the solidarity of a cartel. • This is hard because each member has a strong incentive to “defect” and offer more of its oil for sale at the prevailing higher price. Most members could not add to sales enough to drive down price and so they could possibly gain some significant short-run advantage by, perhaps, increasing their own sales by 20% to reap this higher price.
Two key factors render OPEC a successful cartel: 1. Oil is not a perishable commodity (such as fish that have been caught, or grain that has been harvested) and oil can be easily controlled by holding it in storage tanks or releasing it for sale as needed. 2. Saudi Arabia is the “trump player.” That is, Saudi Arabia has so much oil that it can punish a defector who decides to exceed agreed-upon sales limits by immediately dumping (or indeed by threatening to dump) enough oil on the market to sink the price and defeat the hoped-for profit of the rogue country (one who threatens to defect from the agreement over production targets). Here is the figure of world oil reserves again.
So OPEC has survived for a very long time by exercising tight control over its members and, in essence, forcing them to remain loyal to the club.