Download
1 / 11
110 likes | 214 Views
Adding value to Big Data in Healthcare Through Future Research Initiatives. An IBM – NC State College of Management/CIMS Collaboration. How do we to transform data into Knowledge?.

E N D
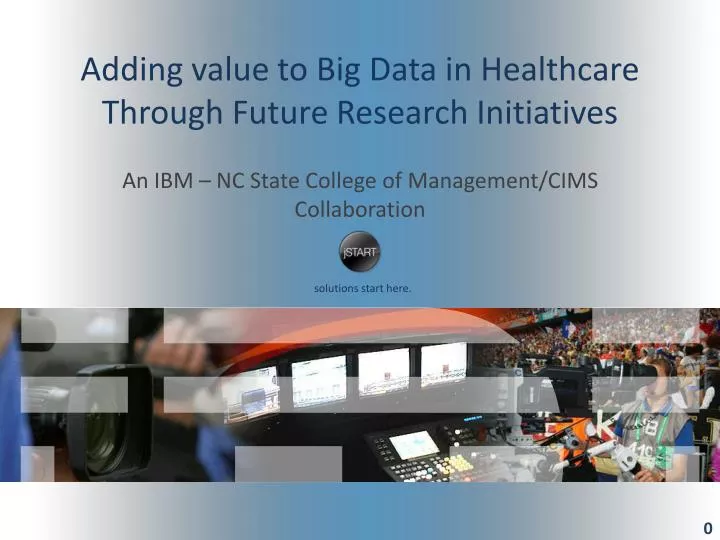
Adding value to Big Data in Healthcare Through Future Research Initiatives An IBM – NC State College of Management/CIMS Collaboration
How do we to transform data into Knowledge? Understand what concepts and relationships are important for your business – start small (prioritize) and then scale out. Understand Identify one or more data sources that may contribute to the model definition, such as SMEs, RDBs, and LODs. Harvest Map the data into a flexible business ontology and enhance with lexical, syntactic, and semantic descriptions, as appropriate. Model Integrate (compile) the business ontology into your content analysis platform – concepts, relationships, and domain topology. Integrate Integrate the content analysis service, and resulting knowledge repository, throughout your business to maximize the ROI realized by this new intelligence layer. Business
Knowledge Maturity Model Semantic Reasoning Business Value Relationships & Inferencing Logic Engine Disambiguation Inference Engine Entity Extraction Statistical Analysis Machine Learning Modeling Rules Engine Ontologies Triples Descriptive AnalyticsPredictive Analytics Dictionary Thesaurus Glossary Taxonomies Rules, Heuristics Linked Data Visualization Capabilities Increasing Maturity Syntactic identification of terms Concepts defined, Capture context, assess sentiment, resolve references and identify characteristics Identify multi-level linkages, highlight asymmetry, classify (basic & deductive) Derive knowledge, Auto-refinement
IBM Content Analytics Components Where we are today Copy Right IBM 2011
Where we are today Instances of facets within documents Facets
Massively Parallel Probabilistic Architecture Where we are Going E. Sources A. Sources Deep Evidence Scoring Answer Scoring Supporting Evidence Retrieval Question Primary Search Candidate Answer Generation Evidence Retrieval Deep Evidence Scoring Synthesis Final Merging & Ranking Question/Topic Analysis Hypothesis & Evidence Scoring Query Decomposition Hypothesis Generation Trained Models Soft Filtering Hypothesis & Evidence Scoring Hypothesis Generation Soft Filtering Hypothesis & Evidence Scoring Hypothesis Generation Answer, Confidence . . . . . . Copy Right IBM 2011
Where we are Going Copy Right IBM 2011
Potential Watson-enabled Healthcare Solutions Longitudinal Personalized Care Benefits Providers Pre-AuthorizationTreatment Analysis Second Opinion Ask Watson Treatment Protocol Analysis Treatment Recommendation Patient Inquiry Healthcare Providers Differential Diagnosis Patient Workup Specialty Deep Diagnosis Specialty Research Genomic-based Analysis Specialty Providers Patients Caregivers Physicians Watson for Healthcare | IBM Confidential
One path to explore -Smart Visualization How do we get there? • Visualization recommender • Dynamically recommend/compose the most suitable visualization for user situations (e.g., data, task, and environment) • Adaptive visualization • Incrementally update existing visualization to accommodate changing situations (e.g., changing data or visual forms) • Weaving analytics and visualization together • Analytics helps create more effective visualization • Visualization assists analytics by allowing users to “see” the data 3 Visualization 1 2
Interacting with Visual Summary “people” involved and their relationships