Download
1 / 37
380 likes | 489 Views
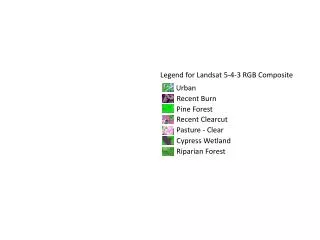
Urban Systems. 1M inhabitant Cities w. Definitions Census; people/area. United States : 386 /km2 (1000 people/mi2) Surrounding area has 193/km2 Japan 4000 people/km2 Australia 200 people/km2 total and > 1000. Urban Sprawl. “Where” Loss of Ag Lands Natural Disasters.

E N D
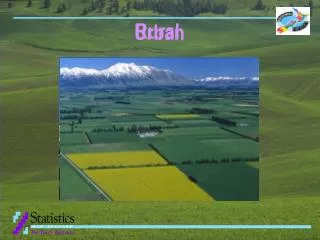
1M inhabitant Citiesw
DefinitionsCensus; people/area • United States: • 386 /km2 (1000 people/mi2) • Surrounding area has 193/km2 • Japan • 4000 people/km2 • Australia • 200 people/km2 total and > 1000
Urban Sprawl “Where” Loss of Ag Lands Natural Disasters
Coastal Population Bomb Areas < 5 miles of coast are growing 3x the national average Development in high-risk coastal areas increased 60% between 1980-2000
Is the Global Urban Population Growth Rateincreasing or decreasing?
Urban Growth Rate Is Decreasing World ~ 1.5%/year
Only Asia and Africa have > 50% rural populations More than 50% of the world’s population lives in cities 50 %
Environmental Advantages/Disadvantagesof Urban Areas • Advantages of higher population density • Lower per capita transportation energy use • Higher access to education, health care.. • Lower ecological foot-print • Disadvantages of higher population density • Public Health; crime, disease • Concentration of pollution • Loss of connection to nature • “Humanity overtakes Nature with Fossil Fuels”
Urban Heat Islands • Urban Hydrology • Urban Water Quality Issues
Heat Waves; “Silent Killer” Increases mortality associated with excessive and prolonged heat Typically associated with urban environments
Public Perception of Heat Waves“silent killer” • Impact people who live alone • Poor, elderly, sick, alone have highest risk • Increasing % of population live alone • Minor Property Damage • Slow and preventable • “Forgotten as soon as temperatures drop”
Daytime Temp difference 7/03-7/02 2003 European Heat Wave Hottest since 1500 AD Up to 14,800 deaths in France 35,000 deaths in Europe Melting of Matterhorn Triggered rock slides High ozone levels Early & poor wine season 10 C hotter New Scientist, Oct 03
2003 Temp Paris France Mean temp Daily mortality
Why are urban areas hotter? • Heat produces by urban activities • Air conditioners, cars, factories, people… • Greater heat storage by structures • Buildings & pavement vs plants & water • Greater air pollution haze & cloud cover • Heat trap • Respiratory problems • Lower winds (urban canyons) • Less heat exchange • Lower Humidity: drier • More evaporation from human bodies
Diurnal variation in Air temperature Greatest difference in late afternoon Urban areas do not cool as quickly as Rural Greatest difference Near mid-night
Management Options? • Heat produces by urban activities • Increase efficiency, heat pumps to ground • Greater heat storage by structures • Increase vegetation; green roofs, tree lined streets, parks • Greater air pollution haze & cloud cover • Reduce discharge during peak periods • Lower winds (urban canyons) • Design of new buildings • Lower Humidity: drier • Maintain body fluids
Benefits Reduced energy loss Reduce urban heat Reduce storm runoff Sound insulation Costs More expensive More Maintenance Not for all buildings How to spend Limited funds Trees vs Roofs
Philadelphia Heat Wave Prevention Plan • 1993 Heat wave; 115 deaths in over summer • Warning system; (Stage 1, Stage 2) • Buddy system with block captains • Media and education campaign • Utility subsidize; no terminations • Extended hours of senior service centers • Program for roof replacements, reforestation..
Modeled Risk > 65, poor, living alone Identify areas of risk Satellite Data Census Date ~ 24% variance In mortality
Did it work?Philadelphia Heat Waves 93 vs 02 • 1993 Heat wave • 115 deaths • 2002 Heat wave • 33 deaths
Urban Heat Islands • Urban Hydrology • Urban Water Quality Issues
ET = Interception + transpiration Precipitation 100% Throughfall Surface Runoff Groundwater Runoff To stream channel
How does Urbanization influence water cycle? Interception ~ 0 Transpiration = 0 Evaporation ~ 0 Precipitation 100% Throughfall = P Stemflow = 0 Surface Runoff ~ P More water downstream Groundwater runoff = 0
Issues & Options • Issues: Urban runoff • Downstream flooding • Water quality; CSO • Options • Precipitation Management; urban heat islands • ET Management; vegetation management • Runoff Management
ET Management • Direct: Manage land cover • “cut down trees for more water” • Conifers vs evergreen vs deciduous • Agricultural use • Indirect: • Wind breaks • Urban heat islands
Runoff Management “slow down water to use it later” “get it out of here..” ET; manage land cover Precipitation 100% Runoff Management Manage Vegetation & Surface Manage infiltration Manage stream channels 1) Promote aquifer recharge 2) Storm water runoff ponds 3) Dams & reservoirs Surface Runoff Soil Moisture Groundwater Shallow Deep
Land cover modifies travel time, water use Urban = faster travel time, lower water use = higher peaks, greater volume
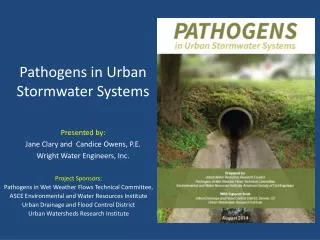
Water Quality Issues “Water quality is a relative concept that reflects measurable physical, chemical, and biological characteristics in relation to a specific use” • WQ for instream and off-stream uses • Drinkable vs swimmable vs industrial vs agricultural vs thermal • Clean Water Act (1972) • “fishable and swimmable” • Water body assessments Major pollutants and sources
Urban WQ Pollutants • Temperature; urban discharges & runoff • 10C increase will double metabolic rate, 5C change can alter community structure • Warm water from thermal plants • Warm water from street runoff • Cold water releases from dams • Management; • Cool before it enters (cooling towers) • Warm before it enters (ponds) • Withdraw at different reservoir levels • Maintain riparian canopy cover
Urban WQ Pollutants • Nitrogen • DNA, RNA, TNT, fertilizer & sewage, • Green house gas, smog, acid rain… • Most common water pollutant in USA; • 2x pre industrial inputs • Increases algae, decreases DO… • Management • Sewage Treatment Plants • Keep it out; • fertilizer management • Runoff control; buffer zones • Wetlands absorption
WQ Pollutants • Sediment • Water clarity • temp, food production in aquatic environments.. • Modify habitat; • Fish spanning • Recreation • Reservoir and channel filling; • loss of habitat, hydropower, increased flooding?? • Navigation • Management: • keep it out; upland controls, riparian buffers • Detention ponds trapping • Dredging
Vision for the Urban future “learning how to live with less energy and a smaller economy” “doesn’t mean going backwards” • Urban Clusters & high density housing • In geologically safe areas • Integrated transportation & information • Less and more efficient transportation • Urban gardens and green areas • Local food sources • Incentives for reduced consumption