Download

1 / 31
330 likes | 435 Views
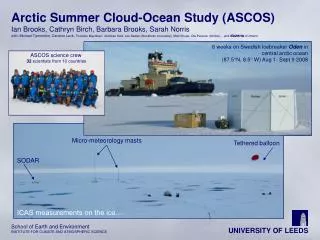
ISU SODAR Team sddec 10-06. Ashor Chirackal Michelle tan Imran butt Luke lehman Client: Mr. Josh Underwood, ASC Advisor: Dr. tim bigelow. Background. The SODAR system measures wind shear for up to 200 meters in the atmosphere. i s designed by the Atmospheric Systems Co.

E N D
ISU SODAR Teamsddec 10-06 AshorChirackal Michelle tan Imran butt Luke lehman Client: Mr. Josh Underwood, ASC Advisor: Dr. timbigelow
Background The SODAR system measures wind shear for up to 200 meters in the atmosphere. is designed by the Atmospheric Systems Co. is designed to be autonomous. powered by a solar panel and has a generator as a secondary source. operates by emitting sound waves from its speakers and listens for the reflection.
Project Plan Problem Statement: Optimizing the number of times the heater is turned on to reduce power consumption by designing a more efficient and accurate method to detect the conditions in which the SODAR equipment needs to use the heater. The necessary conditions and requirements are outlined below: • Ability to detect frozen precipitation that distorts the SODAR readings and needs to be melted. • Turns heater on only when necessary. • Turns heater off after frozen precipitation has melted.
Problems Elaborated Operation of the SODAR when clear and covered with frozen precipitation
Current System detects the possibility of frozen precipitation and decides whether melting is required picks up many “false positives” where freezing conditions are detected, but heating is not necessary wastes fuel during these “false positives”
Functional Requirements • Frozen Precipitation Detector • must withstand the temperature of the heating pad. • must not interfere with the acoustic environment of the SODAR. • must use less power than the current detector.
Solution • Use piezoelectric sensors to check the state of the reflector board. • Use the voltage from the piezoelectric sensors to determine if heating is necessary • Below a certain threshold voltage, heater should be on • Above a certain threshold voltage, heater should be off
Piezoelectric Used PZ-04 - Raw Piezofilm Manufacturer
Piezoelectric sensors plates Temperature Sensor SODAR speakers Heater Concept Sketch
Test Plan Obtain several piezoelectric sensor applicable to the project Small level testing the piezoelectric sensor characteristics to determine the best option Model circuit components Build circuit components Test piezoelectric sensors under specific conditions Integrate components High level testing using the completed design
Hardware • Piezoelectric sensor • Detects sound waves emitted from the SODAR • Minimal power consumption • Differentiate amplitudes of clear reflector versus snow covered reflector • Amplifier • Convert small piezoelectric signal to usable level(0-5V) • Filters • Attenuate signal outside 2-5kHz • Peak Detector • Samples and holds values produced by piezoelectric sensors for processing • Comparator • Used for logic operation
User Interface The Frozen Precipitation Detector is designed to be autonomous. User interface should be kept to a minimum. The variance in voltage will determine if the heater is needed.
Testing The major parts of the FPD are as follows: Piezoelectric Amplifier Band-Pass Filters Peak Detector Comparator Construction and testing of these parts was conducted simultaneously in order to produce a rapid prototype.
Testing Simulation of a SODAR signal at a lower level Signal pulses were generated using a signal generator Results were measured with oscilloscopes and a digital multimeter After these subsystems were finalized a prototype system was constructed.
Amplifier An amplifier was used to boost the voltage from the piezoelectric sensor. Rf is a potentiometer which can be adjusted if needed. Gain: 23
Filters Butterworth filters were used to filter noise signal from the output of the piezoelectric sensor. This filter only let the frequencies between 2 kHz and 5.5 kHz.
Peak Detector This is used to hold the maximum voltage generated by the piezoelectric sensor. The output voltage of this circuit is fed into a LED. When the LED is on, heating is not necessary. If it is off, heating is necessary.
Comparator The comparator is used to implement the final logic operation of the FPD Threshold: 2.25 V Input/Output relation:
Testing Combined the amplifier, filters, and peak detector together Input was a waveform generator Output was an LED
Implementation Implementation of the FPD involves permanent attachment of the circuitry and piezoelectric to SODAR systems. These SODAR systems must be operated in environments that produce frozen precipitation and must have a heating unit installed.
Implementation The FPD was implemented on a SODAR system lacking the heating hardware. The output of the prototype FPD was routed to an LED The prototype FPD was not permanently installed on the SODAR
Input The input is the sound the speaker emits. The piezoelectric sensor generates a voltage from this sound
Output The output received by the oscilloscope Frequency: 4.402 KHz Pk-Pk Voltage Range: 30-160mV
Output After amplifying and filtering the output is Pk-Pk Voltage 1: 3.62 V Pk-Pk Voltage 2: 2.30 V Pk-Pk Voltage 3: 0.563 V
Final Results • The voltage generated by the piezoelectric due to the sound burst is 150mV • The output from the piezoelectric is amplified by a factor of 23 • The peak detector gives 85-90% of the peak value at its input as a DC output • The comparator implements the final logic operation to determine if the reflector pas is covered with frozen precipitation • The time taken for the sensor to reflect a change in the state i.e. from clear to covered is less than 60 seconds
Evaluation • Mr. Josh Underwood of Atmospheric Systems Corporation in Santa Clarita, California is our client. • Correspondence with Mr. Underwood included design criteria, SODAR specifications and informal evaluation of the FPD. • Primary evaluation was conducted by the team at Iowa State laboratories in the Electrical Engineering department and at the Cedar Falls test site. • testing of the individual subsystems using simulated inputs • testing using real-world inputs from the SODAR system. • Evaluation was based on original design criteria provided by John Deere Renewables and was modified according to new client interaction and availability of necessary equipment. • Primary goals • fabrication of a working prototype, • implementation of a working prototype on a SODAR system • fulfillment of design criteria such as cost, energy consumption, ease of fabrication, etc.
Future Work • Adapt prototype to specific SODAR models • PCB layout and encasement • Protect piezoelectric sensors • Permanent attachment of sensors • Power & output connectors
Recommendations • Interface with existing precipitation detector circuitry • Increase accuracy • Add redundant piezoelectric films and circuits • Increase reliability • Increase coverage • Conduct a longer evaluation period • Installation on SODAR with heating element • Use during inclement weather