Download

1 / 68
840 likes | 1.34k Views
ECG Basics. The Normal Conduction System. What is an ECG?. The electrocardiogram (ECG) is a representation of the electrical events of the cardiac cycle. Each event has a distinctive waveform, the study of which can lead to greater insight into a patient’s cardiac pathophysiology.

E N D
What is an ECG? The electrocardiogram (ECG) is a representation of the electrical events of the cardiac cycle. Each event has a distinctive waveform, the study of which can lead to greater insight into a patient’s cardiac pathophysiology.
What types of pathology can we identify and study from ECGs? • Arrhythmias • Myocardial ischemia and infarction • Pericarditis • Chamber hypertrophy • Electrolyte disturbances (i.e. hyperkalemia, hypokalemia) • Drug toxicity (i.e. digoxin and drugs which prolong the QT interval)
Parts of the ECG(Waveforms and Intervals) Parts of the ECG
ECG Leads Leads are electrodes which measure the difference in electrical potential between either: 1. Two different points on the body (bipolar leads) 2. One point on the body and a virtual reference point with zero electrical potential, located in the center of the heart (unipolar leads)
ECG Leads The standard EKG has 12 leads: 3 Standard Limb Leads 3 Augmented Limb Leads 6 Precordial Leads The axis of a particular lead represents the viewpoint from which it looks at the heart.
The Standard Leads • Lead I is obtained by measuring the voltage between the left arm and right arm. • The left arm is the positive pole. An electrical wave moving towards the left arm will cause an upward deflection of the ECG machine stylus on the paper. • Lead I is most useful for seeing electrical activity moving in a horizontal direction.
The Standard Leads • Lead II connects the right arm to the leg, and therefore best sees electricity moving down and leftward.
The Standard Leads • Lead III compares voltage in left arm and the leg, and will measure electricity moving down and rightward. • Lead II and Lead III are positive at the foot
The Augmented Leads • Three additional limb leads can be obtained by mixing combinations of electrodes. These are leads R, L, and F.To create these limb leads, two electrodes are connected together to create an “average” electrode, then connected through the ECG machine to the remaining electrode.
The Augmented Leads • Lead F is created by connecting the two arms together to create an “average” electrode. To the ECG machine, this combination looks like a single electrode midway between the two arms — directly in the center of the body above the heart. This “average” electrode is connected through the ECG machine to the foot electrode
The Augmented Leads • Lead L is created by connecting the right arm and the leg together, then comparing this “average” electrode to the left arm electrode. The left arm electrode is positive, meaning that electricity moving to the left will cause an upward motion of the ECG stylus.
The Augmented Leads • To create lead R, the left arm and the foot electrodes are connected together, then the voltage of this “average” electrode is compared to the right arm lead. • Because lead R “aims” in the opposite direction from the other limb leads, its ECG waveforms will usually be “upside down” by comparison. • This means that every electrical wave in lead R should have a net negative direction, unless pathology is present.
Precordial Leads The precordial (chest) leads start with: • Lead V1 is placed in the 4th intercostal space, near by right edge of sternum • Lead V2 is opposite LeadV1 at the left side of the sternum. • Lead V3 is halfway to lead V4, which is placed below rib 5 on the midclavicular line. • Lead V5 is straight around the chest from LeadV4, on the anterior axillary line. • LeadV6 is directly around from LeadV5, straight down from the middle of the armpit (the mid-axillary line)
The ECG Grid • The paper on which the ECG is drawn is divided up into 1 millimeter lines horizontally and vertically. The vertical lines represent passage of time. Because the paper moves at a rate of 25 mm per second, each 1 mm line represents 0.04 seconds of time. Every fifth line is darkened to help with counting. The time between large boxes (darkened lines) is 0.2 seconds, and five large boxes equals one second.
The ECG Grid • The vertical direction represents the strength of electrical voltage. Positive voltage moves the stylus up, negative voltage moves it downward. Each millimeter vertically represents 0.1 millivolt. Ten vertical boxes is one millivolt. • The horizontal direction represents passage of time
Parts of the ECG The P Wave • The P wave represents the spread of electrical activity over the atrium. The normal depolarization begins at the sinoatrial (SA) node near the top of the atrium. It’s normally largest in lead II. The normal P wave is upright in all leads except R. • The P wave normally lasts less than 0.11 seconds (just less than three small boxes). An abnormally long P wave occurs whenever it takes extra time for the electrical wave to reach the entire atrium. This occurs in left atrial enlargement. • The height of the Pwave is normally less than 2.5 small boxes (less than 0.25 millivolts). An abnormally tall P wave is seen when larger amounts of electricity are moving over the atrium. This usually indicates hypertrophy of the right atrium. The P wave may be decreased in height by hyperkalemia.
Parts of the ECG The PR Interval: • Following the P wave is the PR segment. (NOTE: the PR segment and the PR interval are NOT the same thing.) The PR segment is not routinely measured, but may be commented on if it is depressed or elevated. During the PR segment, the electrical wave moves slowly through the atrioventricular (AV) node. This activity is not seen on the ECG. • The PR interval is the time from the beginning of the P wave until the beginning of the QRS complex. It is normally between 0.12 and 0.2 seconds (three to five small boxes) in length. • The PR interval may be prolonged when conduction of the electrical wave through the AV node is slow. This may be seen with degenerative disease of the node, or with digoxin, hyperkalemia, hypercalcemia, or hypothermia. • The PR interval may be unusually short when conduction is rapid. A mildly short PR interval may be seen with hypokalemia or hypocalcemia. An artificially-short PR interval occurs when the QRS complex begins early, as happens with an extra conducting bundle — Wolff-Parkinson-White Syndrome (WPW).
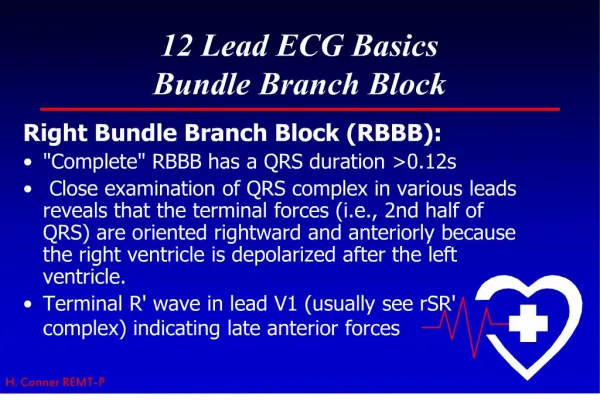
Parts of the ECG The QRS Complex: • The QRS complex represents activation of the ventricle. • The QRS complex is normally less than 0.10 seconds in length — two and a half boxes. Lengthening of the QRS indicates some blockage of the electrical action in the conducting system. This may be due to ischemia, necrosis of the conducting tissue, electrolyte abnormality, or hypothermia.
Parts of the ECG Q wave • If the first deflection of the QRS is downward, it’s called a Q wave. The Q wave represents activation of the ventricular septum. The electricity spreads from right to left through the septum. • Q waves may be normal. For example in lead I, a Q less than 1/4 of the R height, and less than one box wide, is considered normal. This is the early activation of the septum. This activation goes left — away from lead I — and is therefore negative on the ECG. “Septal Qs” are normal in I, F, V5 and V6. Qs are also generally innocent in lead III and lead V1 if no other abnormality is seen. • Q waves are “significant” if they are greater than 1 box in width (longer than 0.04 msec) OR are larger than 1/4 of the R wave. Significant Q waves indicate either myocardial infarction or obstructive septal hypertrophy (IHSS).
Parts of the ECG R wave • The first upward deflection of the QRS is called the R wave. Most of the ventricle is activated during the R wave. The R wave may be prolonged if the ventricle is enlarged, and may be abnormally high (indicating strong voltage) if the ventricular muscle tissue is hypertrophied.
Parts of the ECG S wave • The S wave is any downward deflection following the R wave. Like the R wave, an abnormally large S wave may indicate hypertrophy of the ventricle.
Parts of the ECG The ST Segment • The ST segment is the portion of the tracing falling between the QRS complex and the T wave. During this time, the ventricle is contracting, but no electricity is flowing. The ST segment is therefore usually even with the baseline. • The length of the ST segmentshortens with increasing heart rate. Abnormality of electrolytes may also affect the ST segment length, however measurement of the length of the ST segment alone is usually not of any clinical use. • Upward or downward shifts in the ST segment are extremely important. Deviation of the ST segment from baseline can indicate infarction or ischemia, pericarditis, electrolyte abnormality, or ventricular strain. ST segment elevation or depression is generally measured at a point two boxes beyond the QRS complex.
Parts of the ECG The T wave • The T wave represents the wave of repolarization, as the ventricle prepares to fire again. The T wave is normally upright in leads I, II, and V3-V6. It is normally inverted in lead R. Ts are variable in the other leads (III, L, F, and V1-V2). • T wave abnormalities may be seen with, or without ST segment abnormality. Tall T waves may be seen in hyperkalemia or very early myocardial infarction. Flat T waves occur in many conditions. Inverted T waves may be seen in both ischemia and infarction, late in pericarditis, ventricular hypertrophy, bundle branch block, and cerebral disease. • In young children, T waves may be inverted in the right precordial leads (V1 to V3). Occasionally, these T inversions persist in young adults.
Parts of the ECG The U Wave • A second wave following the T wave is called a U wave. Large U waves may be seen in electrolyte abnormality (such as hypokalemia), or with drug effects.
Parts of the ECG The QT Interval • The QT interval is the time from the beginning of the QRS complex until the end of the T wave. The “normal” QT length varies with heart rate. Very fast rates shorten the QT length. • At normal heart rates, QT length is abnormal if it’s greater than 0.40 sec (10 boxes) for males and 0.44 sec (11 boxes) for females. Extreme QT prolongations (greater than 0.60 sec — 15 small boxes) predispose the patient to arrhythmias. • The QT interval may be prolonged with electrolyte abnormality, such as hypokalemia, hypocalcemia, or hypomagnesemia. Myocardial ischemia may also prolong the QT interval.
Sequence of ECG analysis • Exclusion of technical faults • Estimation: the strength of electrical voltage • What is the rhythm? Is the rhythmregular or irregular ? • What is the rate? • Determining QRS axis. • Check the waves, intervals, complexes • ECG conclusion • Compare ECG data with- age and body habitus of patient - physiologicfeatures (e.g. pregnancy) - clinical findings - treatment
Where to look • Look for P waves. Are they all the same shape? Are there any inverted Ps other than in lead R? Does the PR interval vary? Are there any non-conducted P waves? Is the P wave abnormally wide or high? • Check the PR interval. Is there first degree AV block? Is the PR abnormally short? • Look at the QRS complex in each lead. Is the QRS axis normal? Is the QRS width normal? Do the wave forms suggest conduction block? Are there significant Q waves? Is the precordial R wave pattern normal? Are the QRS complexes too small or too large? • Look at the ST segments. Is there an abnormality? Is the abnormality diagnostic of ischemia, infarction, or ventricular strain?Check the T waves. Is the shape normal? Are there inverted Ts in I, II, or V3-V6? • Look at the QT interval. Is it over half the R-R distance, or over 10 boxes in length?Once you spot an abnormality, check for other findings that firm up the diagnosis. For example, when you spot a large R in V1, you check for axis deviation, ST depression, and the orientation of the P wave in V1.
The sinus rhythm P-wave precedes QRS complex
The regular rhythm • RR intervals are equal
Determining the Heart Rate • Rule of 300 • 10 Second Rule
Rule of 300 Take the number of “big boxes” between neighboring QRS complexes, and divide this into 300. The result will be approximately equal to the rate Although fast, this method only works for regular rhythms.
What is the heart rate? (300 / 6) = 50 bpm
What is the heart rate? (300 / ~ 4) = ~ 75 bpm