Download

1 / 19
190 likes | 366 Views
Marketing Analysts, LLC. Variable Selection in R. Fun with carets, elasticnets, and the Reverend Thomas Bayes …. Charles Ellis, MAi Research Mitchell Killian, Ipsos Marketing. Why do Variable Selection?. "Pluralitas non est ponenda sine neccesitate"

E N D
Marketing Analysts, LLC Variable Selection in R Fun with carets, elasticnets, and the Reverend Thomas Bayes … Charles Ellis, MAi Research Mitchell Killian, Ipsos Marketing
Why do Variable Selection? "Pluralitas non est ponenda sine neccesitate" • Overcoming the “Curse of Dimensionality” and developing more efficient data mining activities • Identifying relevant features & discarding those that are not • Enhancing the performance of data mining algorithms • Better prediction/classification • This applies to almost all fields, but especially those that are “data rich and theory poor” (e.g., Marketing)
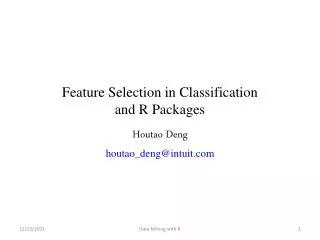
Options for Tackling the Problem • Many different approaches have been suggested … it is a growing field, and many of them are implemented in R code. • BMA • rfe • glmnet • stepPlr • subselect • varselectRF • WilcoxCV • clustvarsel • Party • Boruta • PenalizedSVM • spikeslab • glmulti • BMS
Options for Tackling the Problem • Today we focus on three approaches, which range in degree of complexity and applicability. • Recursive Feature Elimination (package: caret [Kuhn]) • Bayesian Model Averaging (package: bma [Raftery et al.]) • Penalized regression (package: glmnet [Friedman et al.])
Recursive Feature Elimination(with resampling) • Implemented in the package caret • The basic idea (from Kuhn, 2009) • For each resampling unit (default is 10-fold cross-validation) do the following: • Partition the data into training & test sets • Train the model on the training set using all predictors • Predict outcomes using the test data • Calculate variable importance for all predictors
Recursive Feature Elimination (cont’d)(with resampling) • For each subset size (Si)to be considered keep the Si most important variables • Train the model on the training set using the Si predictors • Predict outcomes using the test data [Optional] Recalculate the rankings for each predictor • Calculate the performance profile over the Si predictors using the held-back samples • Determine the appropriate number of predictors • Fit the final model based on the optimal Si using the original training set
Recursive Feature Elimination An Example • Data set up (same across all examples) • Hot Breakfast Cereal Category • N = 310 consumers • Outcome Variable – Overall Liking • 5 point scale • Predictors – 31 Agree-Disagree statements measuring attitudes toward package and its components • 5 point scale • Outcome and predictors are treated as continuous (although they need not be)
Recursive Feature Elimination • The top 5 variables are: q4b_2, q4b_28, q4b_21, q4b_24, q4b_9 Results:
Recursive Feature Elimination Results (cont’d):
Recursive Feature Elimination Results (cont’d):
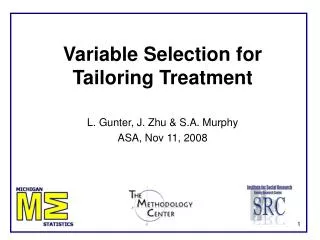
Bayesian Model Averaging • Implemented in the package BMA (also BMS) • The basic idea (from Hoeting et al., 1999) • All models are wrong, some are useful (Box, 1987) • Approach is to average over model uncertainty • Average over the posterior distribution of any statistic (e.g., parameter estimates) • Can be problematic for models with a large number of potential predictors • For “r” predictors, the set of potential models is 2r • Occam’s Window – Average over the subset of models that are supported by the data
Bayesian Model Averaging Note the similarity in the predictors chosen across the 5 best models (compared to the rfe algorithm) Results:
Bayesian Model Averaging Results (cont’d):
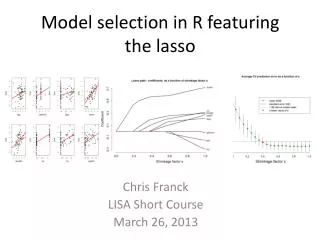
Penalized Regression • Implemented in the package glmnet • glmnet is an extension/application of the elasticnet package (Zou & Hastie, 2008) • The basic idea (from Friedman et al., 2010) • Ridge regression – applies an adjustment (the “ridge”) to the coefficient estimates, allowing them to borrow from each other, and shrinks the coefficients values. • However, Ridge aggressively shrinks coefficients to be equal to each other, allowing for no meaningful interpretation • Additionally, there is no easy way to determine how to set the penalization parameter
Penalized Regression (cont’d) • Lasso regression also adjusts the coefficients but tends to be “somewhat indifferent to very correlated predictors” • Essentially turns coefficients on/off, elevating one variable over another • Elastic Net – a compromise between Ridge and Lasso • Averages the effects of highly correlated predictors to create a “weighted” contribution of each variable • Lambda, a ridge regression penalty, shrinks coefficients toward each other • Alpha influences the number of non-zero coefficients in the model. • Alpha=0 is Ridge Regression and Alpha=1 is Lasso
Penalized Regression (cont’d) Alpha=0 Alpha=1 Alpha=0.2 At each step there is a unique value of lambda
Penalized Regression α= 0.75 α= 0.10 Results: The impact of different parameterizations of alpha
Penalized Regression Again, notice the similarity wrt predictors chosen with the other two algorithms Results: