Download
1 / 21
210 likes | 320 Views
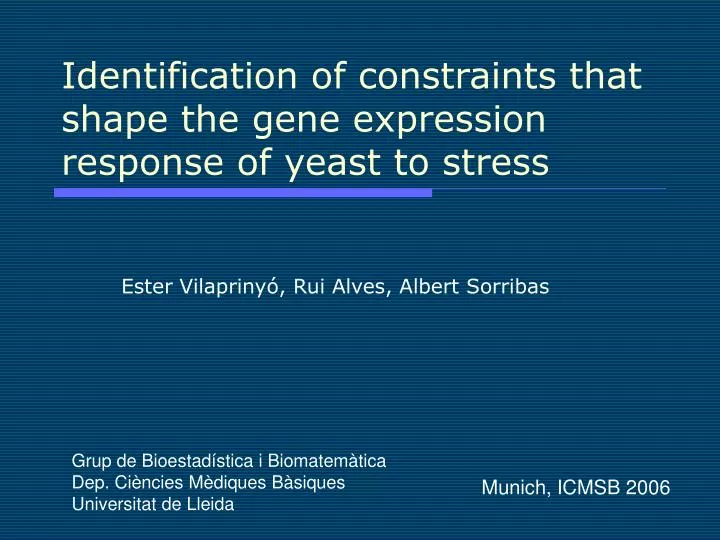
Identification of constraints that shape the gene expression response of yeast to stress. Ester Vilaprinyó, Rui Alves, Albert Sorribas. Grup de Bioestadística i Biomatemàtica Dep. Ciències Mèdiques Bàsiques Universitat de Lleida. Munich, ICMSB 2006. Motivations and Goals.

E N D
Identification of constraints that shape the gene expression response of yeast to stress Ester Vilaprinyó, Rui Alves, Albert Sorribas Grup de Bioestadística i Biomatemàtica Dep. Ciències Mèdiques Bàsiques Universitat de Lleida Munich, ICMSB 2006
Motivations and Goals • Environmental stresses (heat shock, osmotic...) trigger gene expression changes in yeast • ADAPTATION:There is a redistribution of fluxes and metabolite concentrations (physiology). • This can be achieved by different strategies. Only some of them have been selected. • ANTECEDENTS: Voit & Radivovevitch • Seek the constraints that shape the gene expression profile (GEP) of yeast to stress conditions
Glycogen Trehalose Metabolic network REDUCING POWER New synthesis of sphingolipids in order to change the membrane fluidity C3 NADPH STRUCTURAL INTEGRITY -Avoids aggregation of denatured proteins -Membrane -Acts in synergism with chaperones C2 HIGH ENERGY DEMAND C1 Curto, Sorribas, Cascante (1995) Math. Biosci. 130, 25-50 Voit, Radivovevitch (2000) Bioinformatics 16: 1023-1037
×5 ×2 ×3 ×3 7 × 3 × 5 × ×7 ×3 ×5 Glycogen Trehalose ×3 ×3 ×2 ×3 ×5 Methodology NADPH SIMULATIONS To explain why expression of particular genes is changed, we scanned the gene expression space and translated that procedure into different gene expression profiles (GEP) Consider a set of possible values for each enzyme. Explore all possible combinations. Total: 4.637.360 hypothetical GEPs GLK, TPS [ 1, 2.5, 4, ..., 14.5, 16, 17.5, 19] HXT [ 1, 2, 3, 4, 5, 6, 7, 8, 9, 10] G6PDH [1, 2, 3, 4, 5, 6, 7, 8] PFK, TDH, PYK [ 0.25, 0.33, 0.5, 1, 2, 3, 4]
Implementation of stress responses Evaluate HS performance Metabolic network Mathematical model Gene expression changes Power Law form Biochemical System Theory (Savageau, 1969) Generalised Mass Action Each GEP has associated a new steady state→ functional changes → HS index of performance Reproduce basal conditions (25ºC)
Define Heat Shock performance • Eisen et al. PNAS. 1998 Dec 8;95(25):14863-8. DB1http://genome-www.stanford.edu/clustering • Causton et al. Mol Biol Cell. 2001 Feb;12(2):323-37 DB2http://web.wi.mit.edu/young/environment • Gasch et al. Mol Biol Cell. 2000 Dec;11(12):4241-57 DB3http://WW-genome.stanford.edu/yeast_stress SIMULATIONS 4.637.360 hypothetical gene expression profiles (GEPs)
C1- Synthesis of ATP C2- Synthesis of trehalose C3- Synthesis of NADPH Criteria of performance “Well-known” and studied by experimentalist
% of total GEPs Fold change in gene expression C1-C3 Production of trehalose, ATP, and NADPH • If we only consider the criteria concerning an increase of fluxes selects a wide set of possible GEPs (27.8 %, 1.290.454) • The enzymes involved directly in the synthesis should be over-expressed. No clear conclusion can be reached. • In many cases, flux increase involve large metabolite accumulation, which is an undesirable situation in terms of appropriate response ■% of the change-folds before any selection ■% of the change-folds after selecting by C1-C3 HXT: Hexose transporters GLK: Glucokinase PFK: Phosphofructokinase TDH: Glyceraldhyde 3P dehydrogenase PYK: Pyruvate kinase TPS: Trehalose phosphate syntase G6PDH: Glucose-6-P dehydrogenase
C4- Accumulation of intermediates: High fluxes with high metabolite concentrations are considered a sub-optimal adaptation Reactivity Cell solubility Metabolic waste C5- Cost of changing gene expression:GEPs that allow adaptation with minimal changes in gene expression are favoured Adaptation should be economic Minimize protein burden 50 % cost Criteria of performance “Well-known” and studied by experimentalist • C1- Synthesis of ATP • C2- Synthesis of trehalose • C3- Synthesis of NADPH Well-studied within a system biology perspective No experimental measures are available, so we have chosen as a threshold the value that includes de 50% of all the cases
C1- Synthesis of ATP C2- Synthesis of trehalose C3- Synthesis of NADPH C4- Accumulation of intermediates C5- Cost of changing gene expression C6- Glycerol production C7- TPS and PFK over-expression C8- F16P levels should be maintained Criteria of performance “Well-known” and studied by experimentalist Well-studied within a system biology perspective
Glycerol production helps in producing NADPH from NADH New synthesis of glycerolipids required Genes are over-expressed C6- Glycerol production 50% Selecting GEPs with the highest glycerol production is synonymous of selecting GEPs with low PYK over-expression Glicerol rate
TPS is directly related with vtrehalose PFK is inversely related with vtrehalose If PFK is over-expressed, then TPS should also be over-expressed, which compromises the cost Sensitivity analysis shows that the system is highly sensible to change PFK F16P is required for glycerol synthesis F16P feed-forward effect to the lower part of the glycolysis PYK velocity is increased in vitro by as much as 20 by F16P and hexose phosphates in their physiological concentration ranges This enzyme modulation facilitates the flow of material and avoids accumulation of intermediates Glycogen Trehalose C7- TPS and PFK 50% C8- F16P levels should be maintained
% of total GEPs Fold change in gene expression Selected profiles ■% of the change-folds before any selection ■% of the change-folds after selecting by ALL criteria HXT: Hexose transporters GLK: Glucokinase PFK: Phosphofructokinase TDH: Glyceraldhyde 3P dehydrogenase PYK: Piruvate kinase TPS: Trehalose phosphate syntase G6PDH: Glucose-6-P dehydrogenase Fulfill all criteria of HS performance: • SIMULATION: 0.06% of GEPs (4238 ) • All experimental databases
Interpretation • To generate an appropriate HS response some enzymes seems to have a restricted range of allowable variation. • High sensitivity towards these enzymes can explain this result • Enzymes (genes) that show no changes may be very important to understand adaptive responses • Fine tuning of fluxes and metabolite levels should be achieved through coordinated changes in several enzyme levels. • The experimental GEPs are situated within the predicted ranges • Our analysis helps identifying the more appropriate GEPs. Also, we can explain why most of the hypothetical GEPs are inappropriate for HS response. • The considered criteria can be seen as constrains for heat shock performance Vilaprinyo, Alves, Sorribas (2006) BMC Bioinformatics 7(1):184
Are the eight criteria of performance specific of heat shock? We analyzed 294 GEPs from microarray experiments under different environmental conditions Only heat shock conditions are selected
factor1 factor2 factor3 factor4 factor2 factor3 factor4 factor1 What happens under other conditions? (Principal Component Analysis) HeatS factor1 Diamide Stationary H2O2 HeatS factor3 factor2 Sporulation Stationary Diamide H2O2
What next? • Dynamic patterns • Define performance criteria based on dynamics • Obtain precise measurements of the dynamic gene expression changes • Consider additional metabolic processes • Measure in situ levels of metabolites and fluxes • Evaluate the energy and redox status of the cell • Seek for specific constrains that explain differences and shared behaviors with other stress responses
Selected NonSelected
Validation of the model prediction by comparison to microarray data • A statistical analysis shows that the results are with the allowable error • All microarray gene expression profiles fulfill criteria of performance • Noise of databases is derived from the values of change expression at basal conditions (minute 0) Log2 values