Download
1 / 19
190 likes | 310 Views
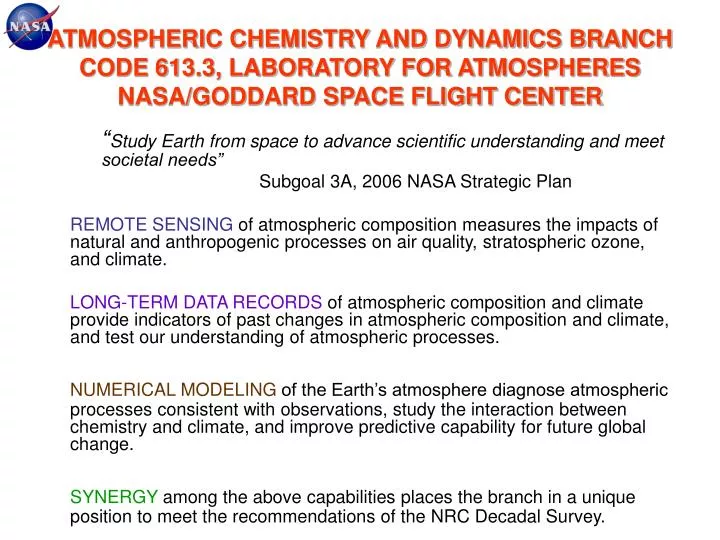
ATMOSPHERIC CHEMISTRY AND DYNAMICS BRANCH CODE 613.3, LABORATORY FOR ATMOSPHERES NASA/GODDARD SPACE FLIGHT CENTER. “ Study Earth from space to advance scientific understanding and meet societal needs” Subgoal 3A, 2006 NASA Strategic Plan

E N D
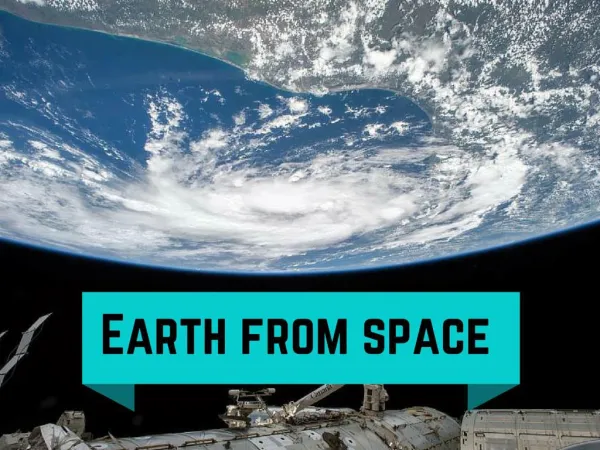
ATMOSPHERIC CHEMISTRY AND DYNAMICS BRANCHCODE 613.3, LABORATORY FOR ATMOSPHERESNASA/GODDARD SPACE FLIGHT CENTER “Study Earth from space to advance scientific understanding and meet societal needs” Subgoal 3A, 2006 NASA Strategic Plan REMOTE SENSING of atmospheric composition measures the impacts of natural and anthropogenic processes on air quality, stratospheric ozone, and climate. LONG-TERM DATA RECORDS of atmospheric composition and climate provide indicators of past changes in atmospheric composition and climate, and test our understanding of atmospheric processes. NUMERICAL MODELING of the Earth’s atmosphere diagnose atmospheric processes consistent with observations, study the interaction between chemistry and climate, and improve predictive capability for future global change. SYNERGY among the above capabilities places the branch in a unique position to meet the recommendations of the NRC Decadal Survey.
TROPOSPHERIC CHEMISTRY FROM SPACEI. Ozone, NOx, VOCs • TROPOSPHERIC OZONE IS THE PRIMARY OXIDANT IN AIR POLLUTION AND IS RESPONSIBLE FOR CONSIDERABLE HEALTH PROBLEMS • TROPOSPHERIC OZONE IN POLLUTED ENVIRONMENTS IS FORMED BY CHEMICAL REACTIONS BETWEEN NITROGEN OXIDES (NOX) AND VOLATILE ORGANIC COMPOUNDS (VOCs), DOWWIND FROM SOURCES. • NOX (NO + NO2) IS PRODUCED BY HUMAN ACTIVITY (PRIMARILY AUTOMOBILE EXHAUST AND POWER PLANT PLUMES). NOX IS ALSO A POLLUTANT THAT CAN ADVERSELY EFFECT HUMAN HEALTH • VOCs ARE PRODUCED NATURALLY BY VEGETATION AND INDUSTRIALLY BY THE BURNING OF CARBON-BASED FUELS • WE CAN NOW MEASURE THE KEY COMPONENTS FROM SATELLITE • NItrogen dioxide (NO2)as a signature of NOx • Formaldehyde (H2CO) as a signature of VOCs • Tropospheric ozone (O3) column, and long-range transport of pollution.
NOx + VOCs --> Ozone Satellites measure critical tropospheric chemicals that impact human health NO2 from OMI on Aura (NOx) Ozone from OMI and MLS on Aura 125 0 5 10 x1016 molec. cm -2 60 ppbv Formaldehyde from OMI on Aura (VOC) 0 0.5 1.15 1.60 x10¹⁶ molec. cm -2
Tropospheric Ozone from OMI-MLS Tropospheric (lower atmosphere) ozone is a toxic pollutant and an EPA criteria pollutant. As industrialization increases, pollutants flow from one country to another and from one continent to another. For the first time we are getting a clear picture of this ozone transport by combining ozone measurements of the stratosphere and the total column to produce the tropospheric amount. Monthly average July and October 2005 Pollution from North America reaches Europe Pollution from China reaches North America Pollution from Africa and South America fills the South Atlantic Pollution from Africa spreads to Australia Global maps of tropospheric ozone showing effects of pollution in the Northern Hemisphere in summer and biomass burning in Southern Hemisphere in spring
TROPOSPHERIC CHEMISTRY FROM SPACE2. SO2 • Sulfur dioxide (SO2) is a tropospheric pollutant and is the precursor for the formation of sulfate aerosol particles. • Sulfur dioxide can be converted to sulfuric acid by reaction with hydroxyl radical (OH), and through liquid-phase reactions in clouds. • Sulfuric acid is converted to sulfate aerosol. • A considerable fraction of tropospheric sulfur comes from anthropogenic activity (burning of high-sulfur coal). • We can now measure the key components from satellite • Sulfur dioxide from power plants and volcanoes • Aerosol properties (scattering and absorption)
SO2 (DU) from GOCART on 04/07/2005 Pollution Pollution Sulfate (DU) from GOCART on 04/07/2005 Sulfur dioxide and aerosol pollution from satellite SO2 (DU) from OMI on 04/07/2005 DU 4.00 3.64 3.28 50N 2.92 40N 2.56 2.20 30N 1.84 Volcano Volcano 1.48 20N 1.12 10N 0.78 0.40 100E 110E 120E 130E 140E 150E • SO2 is a trace gas emitted from fossil fuel combustion and from volcanic eruption, and is the major precursor gas for sulfate aerosol. • On April 7, 2005, The Ozone Monitoring Instrument (OMI) on EOS-Aura satellite detected SO2 pollution plume inland and off-shore of China, as well as volcanic plume from Anatahan Volcano (top left panel). • The GOCART model reproduces similar SO2 distributions (top right), as well as predicts the amount of sulfate that is produced from SO2 oxidation (bottom right).
NASA satellite monitors smelter SO2 emissions Daily SO2 emissions (kilotons) Sept 2004 - Sept 2005 Ecuador/S. Colombia volcanoes La Oroya copper smelter PERU Ilo copper smelter Average SO2 map from OMI • •Daily monitoring of SO2 emissions is possible with OMI. • The Peruvian smelters are among the world’s largest industrial point sources of SO2. OMI measurements facilitate mitigation of health and environmental impacts of SO2 and sulfate aerosol (e.g., visibility impairment, acid rain) close to sources.
ATMOSPHERIC CHEMISTRY FROM SPACE3. Aerosols: pollution trends, dust and smoke transport • Long-term exposures (weeks-years) to fine particles (aerosols) have been associated with reduced lung function, the development of chronic bronchitis and even premature death. Short-term exposures to particles (hours-days) can aggravate lung disease, causing asthma attacks and acute bronchitis, and may also increase susceptibility to respiratory infections. in people with heart disease, short-term exposures have been linked to heart attacks and arrhythmias. • Aerosols are an important component to climate change, but are currently highly uncertain. • Satellite observations indicate increasing trends in anthropogenic aerosols over China and India. • Satellite observations also show the long-range transport of smoke and dust events.
TOMS reveals increasing levels of pollution aerosols in China and India Aerosol Optical Depth China: +17% / decade India: +10% / decade Trends of winter average aerosol optical depth (550 nm) over China and India for the period 1979-2000 TOMS observations. Winter time aerosol trends in Asia reflect the anthropogenic aerosol trends since amounts of other aerosols (e.g. dust) are low in winter.
Long-range transport of smoke from boreal forest fires affecting air quality MODIS AOT 550 nm 200407 • Pollutants originating from forest fires, such as aerosol particles and ozone, can travel long-distances, affecting surface air quality and causing health concerns in downwind areas. • In July 2004, large forest fires occurred in the North America boreal region in Alaska and western Canada. Smoke aerosols were being transported across Canada and even to large areas of continental U.S., affecting regional air qualities. • This event was observed by the NASA satellite sensor MODIS and simulated by the GOCART model, both showing high aerosol amount not only over the entire boreal region but also over the northeastern U.S. GOCART AOT 550 nm 200407
Trans-Pacific transport of Asian dust, impacting climate and air quality in North America Aerosol Index from TOMS satellite instrument Dust AOT from GOCART model simulation 70N 50N 30N 10N April 8, 2001 April 8, 2001 70N 50N 30N 10N 70N 50N 30N 10N April 11, 2001 April 11, 2001 70N 50N 30N 10N 70N 50N 30N 10N April 14, 2001 April 14, 2001 70N 50N 30N 10N 90E 120E 150E 180 150W 120W 90E 120E 150E 180 150W 120W <0 0.3 0.5 0.8 0.9 1.0 1.1 1.2 1.5 2.0 3.0 7.0 <0 0.03 0.05 0.08 0.1 0.15 0.2 0.25 0.3 0.5 1.0 2.0 • Asian dust storms are well known to have large impact on regional air qualities over Asia and Western Pacific. They can be efficiently transported across the Pacific Ocean to affect climate and air quality in North America. • The “perfect storm” in April 2001 was one of the largest Asian dust storm events in recent years. Long-range transport of dust was observed by satellite, aircraft measurements, and ground-based measurements. • The formation of the April 2001 “perfect storm” and its trans-Pacific transport was captured by the TOMS instrument on the Earth Pathfinder satellite (left column) and simulated by the global model GOCART (right column). Additional in-situ and lidar measurements in the U.S. confirmed enhancement of dust in mid-April 2001.
STRATOSPHERE • Ozone screens harmful ultraviolet radiation (UV). Excessive UV exposure can lead to acute cases of sunburn, while long-term exposures have been related to skin cancer as well as cataracts. • Ozone deletion resulted from human-produced halogen containing chemicals such as chlorofluorocarbons (CFCs) and halons. These gases degrade as they move through the stratosphere, releasing chlorine and bromine that then catalytically destroy ozone. The largest impact of CFCs and halons on the ozone layer occurs in the Antarctic and Arctic regions. • ANTARCTIC OZONE HOLE • Models project that the ozone hole should begin to decrease in approximately 2023 in response to international regulations. • 2006: Largest ozone hole on record • 2002: “Split” ozone hole due to dynamical conditions particular to that year. • Impact of ozone hole on Antarctic dynamics leads to ozone increase during summer – Observed, and modeled by chemistry/climate transport model. • MID-LATITUDE OZONE • Consistent, long-term data base from different instruments • Models reproduce past behavior and current observations of stratospheric ozone
550 330 110 Ozone Hole Recovery • Antarctic ozone depletion (the “ozone hole”) is caused by human-produced chlorine and bromine gases (CFC’s). Ozone screens harmful ultraviolet radiation. Now that CFC’s are banned when will the ozone hole recover? • We have developed a parametric model of the ozone hole area that is based upon satellite, ground, and aircraft observations of ozone and chlorine and bromine species. • From this model, we estimate that the ozone hole area will begin to decrease in 2023, and will be fully recovered to 1980’s levels by 2070. • Recent occurrences of particularly small (2002) or large (2006) ozone holes are not indicative of a long-term trend. Sep. 2006 Sep. 2002
Ozone Increase in the Summertime Antarctic Stratosphere GEOS Chemistry Climate Model Simulation • Ozone hole forms in the Antarctic Springtime lower stratosphere. • Coupled chemistry-climate model indicates expected summertime increase in ozone over last two decades • Uncoupled model does not show increase • 25-year data set from SBUV series of satellites confirms that the increase occurs in the atmosphere • This result tests the strength of feedback between ozone and climate in the stratosphere • Future ozone profile measurements should show a decrease in summertime Antarctic ozone as the ozone hole recovers Summer Increase Pressure Altitude (hPa) Month Ozone Hole
Global-scale ozone trends from 25 Years of TOMS and SBUV Measurements • Global-scale ozone trends deduced from satellite measurements quantify the impact of CFCs on the stratosphere. • Future satellite measurements are needed to observe the expected recovery of ozone in response to the Montreal Protocol. • Backscatter ultraviolet instruments (TOMS and SBUV) have been measuring the total column amount of ozone since 1978. • We merged the data from various satellites for the past 25 years to create this data set. We will continue to incorporate new data from SBUV, OMI, and OMPS. 560 Total Ozone (DU) 320 140 March 1979 March 1997
Super-Recovery of Ozone in theUpper Stratosphere • Ozone is expected to recover to its pre-1980 concentrations as CFCs are removed from the atmosphere in accordance with the Montreal Protocol • Continued increases in greenhouse gases (esp. CO2) will continue to cool the stratosphere • Temperature decreases will slow natural ozone loss rates and lead to an increase in ozone • This effect is know as “super-recovery” Results from simulations by the Goddard Chemistry Climate model (GEOS CCM) Super-Recovery Reaches 1960 Values in 2040 Reaches 1980 Values in 2025
Global Total Ozone (60oS-60oN) Chemistry and Transport Model TOMS/SBUV Merged Data 1980 1990 2000 2010 2020 Year Reproducing observed ozone:Establishing a baseline for prediction • The solar cycle, changes in volcanic aerosols, and changes in composition including man-made halogens (Cl and Br species) all contribute to total ozone year-to-year and decadal variability. • Excellent comparisons of model ozone and other constituents with global observations from TOMS, SBUV, UARS, and EOS Aura show that the model is a good tool for predicting future ozone. • Predicted ozone will not return to the 1975-1985 levels until mid-century 330 320 310 300 290 280 270 260 Total Ozone (DU) The time series for the ozone column simulated with the GSFC chemistry and transport model reproduces the time series of TOMS and SBUV observations.
Carbon Cycle • Numerical models using assimilated meteorological fields match observations over a range of time and spatial scales. • State-of-the-art modeling tools are necessary to constrain the global CO2 cycle from observations by the upcoming OCO instrument.
MESOSPHERE • Polar Mesospheric Clouds • Solar Proton Events