Download
1 / 45
450 likes | 608 Views
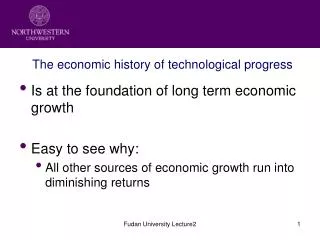
Ch. 5 : MEASURING GDP AND ECONOMIC GROWTH. Define GDP Circular flow model Relationship between aggregate expenditure and aggregate income. Measurement of real GDP and the GDP deflator Real GDP as a measure of economic growth and the limitations of our measure. Gross Domestic Product.

E N D
Ch. 5 : MEASURING GDP AND ECONOMIC GROWTH • Define GDP • Circular flow model • Relationship between aggregate expenditure and aggregate income. • Measurement of real GDP and the GDP deflator • Real GDP as a measure of economic growth and the limitations of our measure
Gross Domestic Product GDP: gross domestic product • the market value of all final goods and services produced in a country by domestically located resources in a given time period. • This definition has four parts: • Market value • Final goods and services • sales of intermediate goods not counted • Produced within a country by domestically located resources • In a given time period • Inventory changes between periods for partially completed products
Gross Domestic Product GDP and the Circular Flow of Expenditure and Income • GDP measures the value of production • equals total expenditure on final goods • equals total income from production. • The circular flow diagram illustrates the equality of income, expenditure, and the value of production.
Suppose that inventories are $20 billion at the end of 2008 and $24 billion at the end of 2009, this means that $4 billion of goods : • Produced in 2008 were not sold in 2008 • Produced in 2009 were not sold in 2009 • Produced in 2008 were sold in 2009 20
Suppose that inventories are $20 billion at the end of 2008 and $15 billion at the end of 2009, this means that $5 billion of goods : • Sold in 2008 were produced prior to 2008 • Sold in 2009 were produced prior to 2009 • Produced in 2009 were unsold in 2009 20
Circular FlowRed=expenditures, Blue=income, Green=borrowing/lending/taxes
Circular Flow Notation • Y=Total income • C=consumption • I=investment • G=government purchases • X-M=exports-imports (net exports • T=net taxes=taxes-transfers • S=household saving
Circular Flow For any given sector, inflows=outflows Household sector: Y=C+S+T Factor markets Y=C+I+G+(X-M) Government T-G=government lending (borrowing)
Circular Flow Rest of World X-M=U.S. lending (borrowing) with rest of world Financial markets S + government budget surplus (deficit) = lending (borrowing) with rest of world
Gross Domestic Product Two ways to measure GDP: • Expenditure Approach: • Aggregate expenditure = C + I + G + (X-M) • Income Approach • Aggregate income = Y = Wages + Rent + Interest + Profit • Because Income and expenditure approach both measure GDP: Y = C + I + G + (X-M)
Gross Domestic Product Financial Flows • Y = C + S + T • Y = C + I + G + (X-M) • S+T = I+G+(X-M)
Gross Domestic Product How Investment Is Financed • The last equation could also be reorganized as: I = S + (T-G) + (M-X) Investment is financed from three sources: • Private saving, S • Government budget surplus, (T – G) • S + (T-G) is “national saving” • Borrowing from the rest of the world (M – X).
Gross Domestic Product Gross vs. Net Domestic Product • “Gross” means before accounting for the depreciation of capital. • Net Domestic Product = GDP – Capital Consumption Allowance.
Stocks versus flows Wealth • a stock representing the value of all the things that people own Saving • A flow that is the source of changes in the stock of wealth. Capital • A stock representing the plant, equipment, and inventories of raw and semi-finished materials that are used to produce other goods Investment • A flow representing the purchases of new capital Depreciation (capital consumption) • A flow representing the decrease in the capital stock that results from wear and tear, and obsolescence.
Stocks vs flows Wealth(t)=Wealth(t-1)+saving Capital(t)=Capital(t-1) + gross investment-depreciation =Capital(t-1) + net investment
If wealth is $26 trillion at the end of 2008 and $27.3 trillion at the end of 2009, then saving was • $1.3 trillion during 2008 • $1.3 trillion during 2009 • -$1.3 trillion during 2008 • -$1.3 trillion during 2009. 20
If capital is $8 trillion at the end of 2008 and $7.7 trillion at the end of 2009 • Gross investment is $.3 trillion in 2009 • Gross investment is $.3 trillion in 2009 • Net investment is $.3 in 2009 • Net investment is -$.3 trillion in 2009 20
Gross Domestic Product • The relationships among capital, gross investment, depreciation, and net investment.
Investment and Depreciation Depreciation is included in: • GDP • Gross profits • Gross Investment Depreciation is removed from • Net National Product • Net profits • Net investment Investment plays a central role in the economy. • Increases in capital are one source of growth in potential real GDP • Fluctuations in investment are one source of fluctuations in real GDP.
Measuring U.S. GDP The National Income and Product Accounts divide net national income into five categories • Compensation of employees • Net interest (paid by business) • Rental income • Corporate profits. • Proprietors’ income.
Measuring U.S. GDP Two items must be added to net domestic income to get GDP • Indirect taxes minus subsidies are added to get from factor cost to market prices. • Depreciation (or capital consumption) is added to get from net domestic product to gross domestic product.
Real GDP and the Price Level • Nominal GDP is the value of final goods and services produced in a given year when valued at the same year’s prices • Real GDP is the value of final goods and services produced in a given year when valued at constant (base year) prices.
2002 NGDP ________ 2003 NGDP ________ Growth rate ________ Base year of 2002 2002 RDGP ________ 2003 RGDP ________ Growth rate ________ Base year of 2003 2002 RDGP ________ 2003 RGDP ________ Growth rate ________ Real GDP and the Price Level
For your answers to the next several slides, give your estimates of GDP to the nearest dollar, do not include decimals, and do not include $ signs.
Chain-weighted method for real GDP • Calculate growth rate in real GDP using last year’s prices. ______ • Calculate growth rate in real GDP using this year’s prices. ______ • Calculate the average of the two growth rates. This average growth rate is the growth rate of real GDP from last year to this year. average growth rate _______ RGDP (using 2002 as base) _________ 4. Repeat steps 1, 2, and 3 for each pair of adjacent years to link real GDP back to the base year’s prices.
GDP deflator Avg. of the prices of the goods in GDP in the current year expressed as a % of the base year prices. Real GDP and the Price Level
Interpreting the GDP-deflator • The GDP-deflator provides a comparison of current year prices with base year prices. • If deflator =100, prices are, on average, the same. • If deflator=150, current year prices are, on average, 1.5 times those in base year (50 percent higher) • If deflator=75, current year prices are, on average .75 times those in base year. (25 percent lower)
The GDP-deflator in 2007 is _____ (give answer rounded to 1 decimal point – e.g. 103.2) 20
The prices in 2007 are ____ percent higher than in 2000. (Give answer rounded to 1 decimal point and exclude % sign – e.g. 5.2 is 5.2%) 20
The prices in 2007 are ____ percent higher than in 1990. (Give answer rounded to 1 decimal point and exclude % sign – e.g. 5.2 is 5.2%) 20
Measuring Economic Growth • The economic growth rate is the percentage change in real GDP from one year to the next.
R-GDP as a measure of economic welfare. Quality improvements Household production Underground economy Health and life expectancy Leisure time Environment Political freedom and social justice Exchange rate in comparing across countries.
If environmental quality worsens, the growth rate in real GDP will _____ the growth rate in the standard of living • Over-state • Under-state 20
If more people begin to hire someone to take care of home projects instead of doing it themselves, the growth rate in real GDP will _____ the growth rate in the standard of living • Over-state • Under-state 20
Suppose U.S. GDP per capita is higher than that in Japan. If people in the U.S. average less hours of work per week than people in Japan, the extra GDP per capita in the U.S. will be an ____ of how much better off people in the U.S are compared to those in Japan. • Overstatement • Understatement 20
Exchange rates and comparisons across countries. • Using actual exchange rate, U.S. real GDP per capita = 69* Chinese real GDP per capita • Using PPP exchange rate, U.S. real GDP = 12*Chinese real GDP per capita. What does this say about actual versus PPP exchange rate?