Download

1 / 20
200 likes | 311 Views
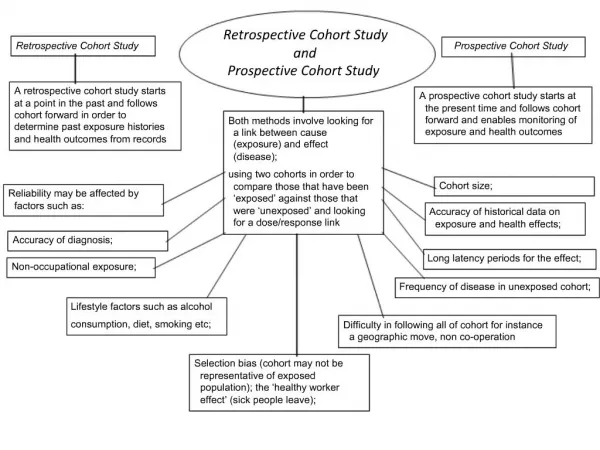
Cohort Study Analysis. Standard 2 X 2 table (Relation between exposure and outcome). Two types of measures for rate. Cumulative incidence = Proportion of study subjects getting the outcome during the study period Incidence rate = New cases/ Person-time under observation.

E N D
Two types of measures for rate • Cumulative incidence = Proportion of study subjects getting the outcome during the study period • Incidence rate = New cases/ Person-time under observation
Comparing risks in different groups • Relative risk OR Risk ratio (RR) • Attributable risk OR Risk difference (AR) • Attributable risk percent (AR%) • Population attributable risk (PAR) • Population attributable risk percent (PAR%) • Odds Ratio (OR)
Relative risk OR Risk ratio • Ratio of the risk among exposed to the risk among unexposed [Risk (Exp) / Risk (Unexp)] • Risk of disease among exposed = [a/ [a+ b)] • Risk of disease among unexposed = [c/ [c +d)] • RR = [a/ [a +b)] / [c/ [c +d)] • For null hypothesis, Risk ratio will equal ‘one’
Risk difference vs. Relative risk 22 Relative risk Absolute risk 1
Attributable risk OR Risk difference (Absolute differences in risks or rates) • Attributable Risk = Risk (Exp) – Risk (Unexp) • Risk of disease among exposed = [a/ [a +b)] • Risk of disease among unexposed = [c/ [c +d)] • Risk difference = [a/ [a +b)] - [c/ [c +d)] • For null hypothesis, Risk difference will equal ‘zero’
Risk difference vs. Relative risk Risk difference Absolute risks(Exp & Unexp)
Attributable risk percent among exposed • Among exposed, what percent of the total risk for disease is due to the exposure • AR% (Exposed) = [Risk (Exp) – Risk (Unexp)]/ Risk (Exp) X 100 = (RR – 1)/ RR X 100 = (OR – 1)/ ORX 100(if risk is small)
Attributable Risk Percent 22 % risk due to exposure Absolute risks (Exp) Relative risk % risk due to background 1
Attributable Risk Percent p0RR p0RR Relative risk p0(RR-1) p0 1 Attributable risk Percent = (RR-1)/ RR *100
Population attributable risk • In the general population, how much of the total risk for disease is due to the risk factor • Risk (Exp) – Risk (Unexp) • Risk (Total) = [Proportion population Exp X Risk (Exp)] + [Proportion population Unexp X Risk (Unexp)]
Population attributable risk percent • Among the general population, what percent of the total risk for disease is due to the risk factor • PAR% = [Risk (Exp) – Risk (Unexp)]/ Risk (Total) X 100 = [Pe (RR – 1)]/ [1+ Pe (RR – 1)] X 100
180 160 140 120 Absolute risk of lung cancer death per 100,000 adult male per year 100 80 60 40 20 0 Smoker Nonsmoker Population attributable risk percent RR Pe(RR-1) (RR-1)(1-Pe) Pe (1-Pe) 1 Population Attributable risk Percent = [Pe (RR – 1)]/ [1+ Pe (RR – 1)] X 100
Odds Ratio • Ratio of the odd among exposed to the odd among unexposed [Odd (Exp) / Odd (Unexp)] • Odd of disease among exposed = [a/ b] • Odd of disease among unexposed = [c/ d] • OR = [a/ b] / [c/ d] = ad/ bc • RR = [a/ a+b] / [c/ c+d] • For null hypothesis, Risk ratio will equal ‘one’ • Under most circumstances, the OR is a good estimate of RR; thus may be used as an estimate of RR
Odds ratio in a Cohort study • An important measure in cohort study also • Link between case control study and cohort study • Link to mainstream analytical process – Logistic regression • What if we are interested in reverse of the event (survival and not death; non-disease and not diseased)
Risk Reduction • Risk (T/t) = a/(a+b) • Risk (Exp) = c/(c+d) • RR = Risk (T/t)/ Risk (Exp) • ARR = Risk (Exp) – Risk (T/t) • RRR = [Risk (Exp) – Risk (T/t)] / Risk (Exp) = 1-Risk(T/t)/Risk(Exp) = 1-RR • NNT = 1/ARR = 1/Risk(Exp)*RRR • NNH