Download
1 / 6
60 likes | 147 Views
Florida Board of Governors Annual Accountability Report 2012-13. June 2009: Impact of Letter of Delegation Reset. June 2009: Impact of Letter of Delegation Reset. Letter of Delegation 2009. June 2009: Impact of Letter of Delegation Reset Graduation Rates. 63%. 65%. 56%. 2009.

E N D
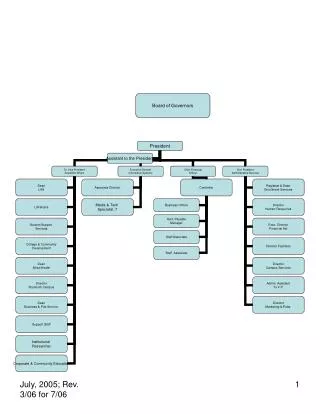
Florida Board of Governors Annual Accountability Report 2012-13
Letter of Delegation 2009 June 2009: Impact of Letter of Delegation Reset Graduation Rates 63% 65% 56% 2009 2010 2011 2012 2013 - 4thyr 4 yr AA Transfers Other Transfers
Positive Metrics • Home campus headcount +6% compared to 2007 Hispanic +124%; intensified recruitment Black +7%; nonurban; still needs work • Undergraduate enrollment +24% • Bachelor’s degrees without excess hours (compared to USF System institutions) – still plan to increase percentages 71% AA Transfers 67% Other Transfers 70% Total • Bachelor’s degrees to Hispanics from 6% (2008-09) to 12% (2012-13) • Bachelor’s degrees to Pell recipients 21% (2008-09) to 56% (2012-13) • Small numbers, but bachelor’s degrees in Security +71%; Master’s in Security +133% - added faculty • Employed full-time 72% (compared to USF System institutions)
Negative Metrics & Plans for Improvement • Graduate Enrollment -52% ; added degrees, increased outreach; primarily relied before on Education degrees • Percentage of bachelor’s degrees awarded to Blacks – stayed same at 6% - increase outreach • Transfer graduation rates – bouncing back after delegation; improved coordination with SCF; personalized advising; improve course schedule • STEM degrees – had one degree, IT; adding Biology in 2014 • R&D expenditures – two staff certified in grant administration, identifying grant sources for faculty • Cost per student (within USF System) – lowest tuition in SUS