Download
1 / 24
290 likes | 446 Views
Water in Emergencies. Session 5 Needs assessment, prioritisation, monitoring. Project Cycle. Davies & Lambert (1995) Engineering in Emergencies, REDR & ITDG. Needs Assessment IRA First, Then Sectors. Triangulate information Ask similar questions to different groups of people

E N D
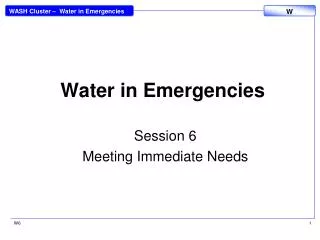
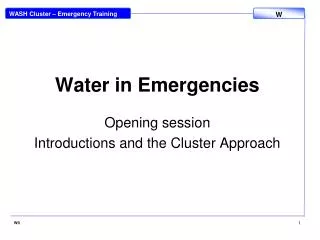
Water in Emergencies Session 5 Needs assessment, prioritisation, monitoring W5
Project Cycle Davies & Lambert (1995) Engineering in Emergencies, REDR & ITDG W5
Needs Assessment IRA First, Then Sectors W5
Triangulate information Ask similar questions to different groups of people Observe Key informants Information Gathering • Quantitative, qualitative • Consider mix of team – female, male, different ethnic groups • To whom are you asking questions? • Are you getting a balanced view? • Can people speak freely? • Any protection concerns for the affected people from you asking questions? W5
Information Gathering Methodologies • Secondary data • Exploratory walk & observations • Key informant interviews • Mapping • Physical measurements • Focus group discussion • Household questionnaire survey • Spot check observations • Seasonal calendar Nepal S Field / OXFAM-GB W5
Mapping House S & Reed, R (1997) Emergency Water Sources, WEDC W5
Importance of Monitoring Appropriateness, effectiveness, impact Useful for modifying objectives W5
Input to Impact Indicator W5
Indicators SMART Specific Measurable Achievable Realistic Time-bound W5
Indicators for Monitoring in Emergencies - Example Hygiene behaviour • Use of safe drinking water Associated WASH indicator • Adequate water handling practices to minimize contamination practiced by x% of the population Associated Sphere indicator • Each household has at least two water collecting containers to ensure there is always water in the household W5
Indicators for Monitoring in Emergencies - Example Hygiene behaviour • Good hygiene practices Associated WASH indicators • Soap or ash for hand-washing is available in all households • Hand-washing facilities are available at 100% of communal latrines or in the majority of homes and are used Associated Sphere indicators • People wash their hands after defecation and before eating and food preparation • There is at least 250g of soap available for personal hygiene per person per month • Average water use for drinking, cooking and personal hygiene in any household is at least 15 litres per person per day W5
Information Management Tools • IRA Initial Rapid Assessment (all clusters) • WASH Survey Tools • RAT Rapid Assessment Tool • CAT Comprehensive Assessment Tool • Monitoring Tool • Agency Report Form • WASH Data Tool W5
‘Initial Rapid Assessment’ (IRA) • Use of the standardised IRA Tool for needs assessment in emergencies: • Collects basic essential data for all sectors • Establishes priority needs • Guides initial planning of emergency support • Encourages cross-sectoral/cluster coordination from the start • Forms the ‘baseline’ against which later assessments will be measured W5
WASH Rapid Assessment Tool (RAT) • Spreadsheet • Used to capture data collection during a rapid assessment process. (The RAT spreadsheet is the same as Section 1 of the CAT form) • Section 1 - General • General information about the site being surveyed with details regarding its physical location and the affected population • Section 2 – Conditions Summary • A summary of the WASH related situation in the surveyed location with each of eight WASH subsectors being evaluated on a scale from 0 (not affected) to 3 (highly affected). Additional comments can be added for each subsector regarding the situation prior to the crisis, specific problems identified and values for critical indicators. • Data • If the electronic spreadsheet is used for data entry, the survey data from section 1 and 2 is summarized on the Data worksheet W5
WASH Cluster Comprehensive Assessment Tool (CAT) • CAT collects more detailed assessment data for the sector, and also: • Coordination mapping tools, needs, gaps and agency activities • Flow-chart analysis aids decision-making • Acts as a progress monitoring tool W5
Comprehensive Assessment Tool (CAT) • CAT standardises the WASH needs assessment in emergencies, using a few key indicators in the 8 sub-sector areas of: • Hygiene Practice • WASH NFIs • Water Supply • Excreta Disposal • Vector Control • Solid waste • Drainage • Representation, equity and participation W5
WASH Monitoring Tool Intervention indicators for each of the eight WASH subsectors. These intervention indicators provide detailed metrics which form the basis of a monitoring program. These are the same as the survey tool of the CAT, except in the monitoring stage achieved values are recorded and values for the targets may be updated W5
Cluster mapping of needs, responses & gaps Northern Uganda, WASH Cluster matrices, Sept – Dec 2007: • NGO WATSAN response plan in rural IDP camps in Gulu District • NGO WATSAN response plan in return areas in Gulu District W5
Cluster mapping, prioritisation, monitoring – needs, responses, gaps Aims to: • Provide clear overview of needs • Analyse responses • Identify gaps • Prioritise responses • Ensure most effective use of resources It will only work with Cluster member & other sector actors effective participation Communicate Coordinate W5