Download
1 / 20
200 likes | 269 Views
Origins of “Worker Scale” Scores: Where do Gender Differences in Beliefs about Effort come from?. Bridgett Harsh, Ed Hirt, & Sean McCrea Indiana University. SELF-HANDICAPPING.

E N D
Origins of “Worker Scale” Scores: Where do Gender Differences in Beliefs about Effort come from? Bridgett Harsh, Ed Hirt, & Sean McCrea Indiana University
SELF-HANDICAPPING • Self-handicapping has been commonly defined as actively seeking or creating situations which will interfere with performance and therefore create an explanation for possible failure outside of individual ability attributions (Arkin and Baumgardner, 1985). • Reducing effort, choosing difficult goals, drug or alcohol use, claims such as anxiety or shyness, etc.
Gender Differences in Self-Handicapping • Men are more likely than women to engage in “behavioral” self-handicapping • Men like (or at least don’t hate) self-handicapping targets in scenario studies • Both men and women engage in claimed self-handicapping • Women strongly dislike self-handicapping targets in scenario studies
Where do these Gender Differences come from? What is driving them? • Women place more normative value on effort than do men • Behavioral handicaps (at least those involving effort withdrawal) are unacceptable in own behavior and behavior of others.
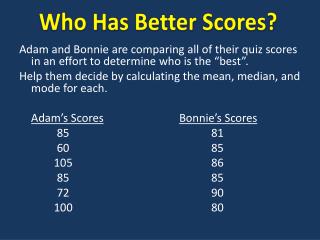
The “WORKER SCALE” • McCrea et al. (2003) develop a scale examining normative beliefs about effort, currently nicknamed the “worker scale”. • 0-5 scale (same as SH scale; 0=strongly disagree, 5=strongly agree) • 10 items • “I pride myself in being a hard worker” • “I try to devote my full effort to every class I take” • “I am proud to admit how hard I work to other people” • Reliability=.85-.88 • Gender Differences found across studies • Men M=22-27, Women M=24-29; p<.01.
More on the “Worker Scale” • McCrea et al. (2003) finds that “worker scale” scores mediate gender differences in behavior (reported preparation for an exam) and evaluations of a self-handicapping target (across all of the “Chris” studies). Study 1Study 2 Worker .19* .46*** .18*(.08) Gender Prep. Worker .19* -.33** -.35***(-.24*) Gender Eval.
Where do “Worker Scale” scores come from?? • There are robust gender diffs in the normative value placed on effort (as measured by the “worker scale”) which mediate gender differences in one’s own behavior & perceptions of others’ behavior. • Where do these differences come from? At what point in time do they develop? Who influences their development?
How to study this issue…? • Towles-Schwen and Fazio (2001) examine the origins of racial attitudes through looking at correlates with childhood experiences. • Questionnaire assessed frequency and nature of participants childhood experiences with African American’s across elementary, middle, and high school. Questionnaire also measured subjects’ perceptions of their parents racial attitudes. • Found that motivation to control prejudice was associated with more positive interactions at all school levels and with perceptions that parents were unprejudiced.
This study... • Borrowed from the Towles-Schwen and Fazio (2001) study by using a questionnaire to look at influences throughout elementary, middle, and high school perceptions of parents’ beliefs and influence. • Questionnaire measured perceived influence on work ethic of elementary, middle, and high school: • Teachers • Coaches • Peers • Also looked at perceptions of: • Parents influence on work ethic • Perceptions of parents’ work ethic
Examples • Teachers: • My teacher emphasized the idea that success is the result of effort and hard work. • My teacher let some students blow things off or slack off sometimes. • My teacher did not accept when I did not work my hardest. • Coaches: • My coach rewarded hard work, even if the performance did not go well • My coach encouraged members of the team to devote full effort to practices.
More Examples • Peers: • My friend worked only as hard as needed in classes. • My friends blew things off more than they should have. • My friends didn’t think it was cool to be a hard worker. • Parents Own: • My parents devote their full effort to everything they undertake. • My parents blow things off more than they should • Parents Infl: • My parents emphasized the idea that performances are based on effort and hard work. • My parents let me blow things off or slack off more than I should have.
More on this study • Additionally looked at: • Gender • SH Scores • SE Scores • Birth Order • Size of school • GPA, SAT, ACT • Involvement in extra-curriculars
Sample Characteristics • N=685 (sort of…) • (389 female, 264 male=down to 653 by q #3) • Worker Scale Scores: • Males (247) = 26.72, Females (371) = 28.30 • t(616)= -2.32, p=.02 • SH Scores: • Males (232) = 61.21, Females (354) = 63.91 • t(584)= -2.69, p=.01 • SE Scores • Males (248) = 50.29, Females (364) = 47.84 • t(610)= 2.27, p=.02
More Sample Chars • GPA (on 13 pt scale 1=A+ 13=F) • Males = 4.68, Females = 4.51; t(650)=1.13, p=.26 • Low Wrkr = 5.14, High Wrkr = 3.94; t(642)=8.24, p=.00 • Low SH = 4.26, High SH = 4.87; t(608)=-3.916, p=.00 • ACT • Males = 5.41, Females = 5.22; t(219)=.805, p=.42 • Low Wrkr = 5.18, High Wrkr = 5.30; t(219)=-.489, p=.63 • Low SH = 5.41, High SH = 5.20; t(201)=.803, p=.423 • SAT • Males = 6.81, Females = 6.37; t(584)=3.42, p=.00 • Low Wrkr = 6.59, High Wrkr=6.51; t(580)=.63, p=.53 • Low SH = 6.64, High SH = 6.46; t(547)=1.288, p=.198
Birth Order • First v. Second Born (Preliminary look) • WRK TOT: • 1st=28.21; 2nd=26.90; t(494)=1.717, p=.08 • SH TOT: • 1st=62.52, 2nd=62.99; t(467)=-.413, p=.68 • SE TOT: • 1st=49.21, 2nd=48.85; t(493)=.294, p=.77
Differences in Skipping Qs • Lots of people skipped huge chunks of the survey….are there gender or worker scale differences? • Gender: t(651)=1.854, p=.064 (males completed marginally more). • Wrkr: t(644)=1.924, p=.055 (high workers completed marginally more). • SH: t(610)=-.023, p=.981 (no differences).
Conclusions • Parents seems to have a strong influence on worker scale scores, particularly for female participants. • Peers and Teachers throughout elementary, middle, and high school also seem to have a significant impact. • Coaches seem to have a smaller (non-significant) impact.