Download
1 / 54
540 likes | 647 Views
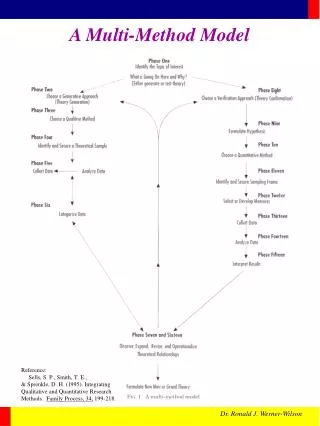
Objective weighting of Multi-Method Seasonal Predictions (Consolidation of Multi-Method Seasonal Forecasts) Huug van den Dool Acknowledgement: David Unger, Peitao Peng, Malaquias Pena, Luke He, Suranjana Saha, Ake Johansson and all data providers. Popular (research) topic.

E N D
Objective weighting of Multi-Method Seasonal Predictions (Consolidation of Multi-Method Seasonal Forecasts) Huug van den Dool Acknowledgement: David Unger, Peitao Peng, Malaquias Pena, Luke He, Suranjana Saha, Ake Johansson and all data providers.
Popular (research) topic • (super) ensembles (>=1992; medium range) • Multi-model ‘approach’ (CTB priority; seasonal) • In general when a forecaster has more than one ‘opinion’. Methods Application to DEMETER-PLUS, (Nino34; Tropical Pacific) • Prelim conclusions, and further work
Oldest reference : Phil Thompson, 1977 Sanders ‘consensus’.
Forecast tools and actual forecast for AMJ2005 CAS CDC OCN OCN+skill mask Absent: CCA, SMT, MRK, CA-SST, NSIPP (via CDC and IRI) local effects, judgement Scripps OFFICIAL OCN IRI ECCA CFS
There may be nothing wrong with subjective consolidation (as practiced right now), but we do not have the time to do that for 26 maps (each ~100 locations). Moreover, new forecasts come in all the time. Something objective (not fully automated!) needs to be installed.
When it comes to multi-methods: • Good: Independent information • Challenge: Co-linearity
m1 m2 m3 m4 m5 ………………m9 equal weights Realism m1 m2 m3 m4 m5 ………………m9 weights proportional to skill m1 m2 m3 m4 m5 ………………m9 weights based on skill and co-linearity sophistication
m1 m2 m3 m4 m5 ………………m9 equal weights Realism m1 m2 m3 m4 m5 ………………m9 weights proportional to skill m1 m2 m3 m4 m5 ………………m9 weights based on skill and co-linearity as per ridge regression, if possible m1 m2 m3 m4 m5 ………………m9 weights based on skill and co-linearity sophistication
Definitions • A, B and C are three forecast methods with a hindcast history 1981-2003. A is short hand for A(y, m, l, s), anomalies. Stratification by m is customary, so A (y, l, s) suffices. y is 1981 to 2003, lead=1, 6(13), space (s) could be gridpoints NH (for example) or Climate Divisions in US. • Matching obs O (y, l, s) • Inner products: AB = ΣA ( y, l, s) * B (y, l, s), where summation is over time y, (some or all of) space s, and perhaps ensemble ‘space’.
In general we look for: Con(solidation) = a*A + b*B + c*C • Simple-minded solution: a = AO/AA, b=BO/BB etc. • a+b+c probably needs an additional constraint like a+b+c=1. a, b and c could be function of s, lead, initial (target) month. a, b and c should always be positive. • We like to do better, but….Simple-minded may be the best we can do
We still look for: Consolidation = a*A + b*B + cC ; minimize distance to O. • Full solution, taking into account both skill by methods and ‘co-linearity’ among methods: Matrix * vector = vector |AAABAC| |a| |AO| |BABBBC| * |b| = |BO| |CACBCC| |c| |CO| • *) main diagonal, *) what is measure for co-linearity? • If co-linearity were zero, note a = AO/AA • No constraint on a+b+c .
Full solution, taking into account both skill by methods and ‘co-linearity’ among methods: AA AB AC a AO BA BB BC b BO CA CB CC c CO If a, b, and c are too sensitive to details of co-linearity, try: • AA +ε2 AB AC a AO BA BB +ε2 BC b BO CA CB CC +ε2 c CO Even very small +ε2 can stabilize the worst possible matrices. Adding +ε2 to main diagonal plays down the role of co-linearity ever so slightly. 2nd layer of amplitude adjustment may be needed
Why is CON difficult? • Science/technology: FAR too little data to determine a,b,c…z, given the number of participating methods (quickly increasing) • Political: Much at stake for external/internal participants (funding, pride, success). Nobody wants to hear: • your model has low skill, or b) your model has some skill, BUT… no skill over and above what we know already via earlier methods (birthrights???). • Funding Agencies have stakes in something they have funded for years. They like to declare success (= CPC(IRI) uses it, and it helps them).
About ridging • Starts with Tikhanov(1950; 1977 in translation) on the math of underdetermined systems. Minimize rms difference (O-CON) as well as Σ a*a+b*b+c*c. • Gandin(1965), where ε2 relates to the (assumed) error in the obs. • Ridging reduces the role of off-diagonal elements • ‘Embrace’ the situation: -) truncate forecast(obs) in EOF space (details?) -) Now determine AA from filtered data…. -) Add ε2 which is related to variance of unresolved EOFs -) Controlled use of noise: off-diagonal elements unchanged. -) solve the system. • Working on: Adjusted ridging where in the limit of infinite noise the simple-minded solution for a, b, c emerges.
Example: Demeter plus • 9 models/methods (7 Demeter, 2 NCEP) • 1981-2001 (1982-2002) • Monthly mean data • Nino34 (all of Eq Pacific) • Only Feb, May, Aug, Nov starts • Use ensemble mean as starting point • Anonymous justice, mdl#1, mdl#9
wrt OIv2 1971-2000 climatology 1 2 3 4 5 Forecast Lead [ months ]
Correlation matrix Demeter plus (m=1, lead=1 Feb March)correlations ………………………………………………………………………………< > sd ac 1.00 .94 .91 .95 .92 .93 .92 .93 .89 .91 .93 1 .94 1.00 .97 .91 .97 .95 .98 .97 .90 .65 .93 2 .91 .97 1.00 .92 .96 .94 .96 .99 .89 .67 .92 3 .95 .91 .92 1.00 .90 .92 .92 .93 .88 1.13 .92 4 .92 .97 .96 .90 1.00 .93 .96 .96 .90 .98 .93 5 .93 .95 .94 .92 .93 1.00 .94 .94 .94 .83 .97 6 .92 .98 .96 .92 .96 .94 1.00 .97 .90 .73 .93 7 .93 .97 .99 .93 .96 .94 .97 1.00 .88 .77 .92 8 .89 .90 .89 .88 .90 .94 .90 .88 1.00 .71 .95 9 1 2 3 4 5 6 7 8 9 sd acstandardize forecasts before proceeding
1 2 3 4 5 6 7 8 9 .14 -.15 .15 .11 .20 .40 .04 -.27 .25 0 (no* ridging) .10 .03 .01 .12 .11 .25 .01 -.02 .27 1 (5% ridging) .10 .04 .03 .11 .09 .21 .03 .01 .24 2 ---- .10 .05 .04 .11 .09 .18 .04 .02 .22 3 .10 .06 .04 .10 .08 .17 .05 .03 .21 4.. .10 .07 .06 .10 .08 .13 .06 .06 .16 9 .10 .07 .06 .10 .08 .13 .07 .06 .15 10 (50% ridging) (.93 .93 .92 .92 .93 .97 .93 .92 .95 ) = ac w |w| w*w %ridg ac m leadsummary: .88 1.72 .42 .00 98.06 1 1 (unconstrained regression) summary: .87 .91 .17 5.00 97.90 1 1 summary: .86 .86 .14 10.00 97.75 1 1…….. summary: .82 .82 .08 50.00 97.09 1 1* NO ridging may not exist. 0 means 0.000…001%
ridge mon lead w(1)... w(9) CON ensave best mdl .10 1 1 .10 .04 .03 .11 .09 .21 .03 .01 .24 97.7 96.4 96.5 ( 6) .25 2 1 .18 .02 .12 -.01 .03 .10 .14 .09 .08 94.2 91.3 90.7 ( 3) .15 3 1 .06 .12 .12 .00 .17 .12 .13 .10 .04 96.4 95.5 95.6 ( 7) .05 4 1 .31 .02 .18 .14 .05 .25 .04 .13 .23 98.4 98.0 97.4 ( 6) .05 1 2 .06 .02 .02 .00 .13 .16 .10 .05 .14 95.5 93.9 91.2 ( 7) .15 2 2 .17 .00 .11 .08 .10 .05 .11 .06 .11 90.9 90.2 87.0 ( 3) .10 3 2 .13 .22 .18 .01 .01 .12 .23 .14 .03 96.0 95.2 95.3 ( 7) .15 4 2 .25 .08 .15 -.01 .13 .26 .11 .14 .18 98.3 97.4 97.6 ( 6) .15 1 3 -.01 .17 .04 .03 .18 .18 .06 .00 .09 91.6 87.5 83.4 ( 3) .25 2 3 .24 .07 .05 .04 .09 .00 .14 .08 .15 89.5 87.1 82.6 ( 9) .30 3 3 .08 .20 .15 .00 .09 .17 .17 .17 .15 96.0 94.7 94.9 ( 2) .30 4 3 .15 .05 .13 .00 .18 .21 .11 .13 .10 96.3 95.1 96.3 ( 6) .25 1 4 -.01 .02 .08 .05 .25 .16 .08 .12 .02 89.3 81.9 81.3 ( 3) .40 2 4 .18 -.01 .02 -.01 .12 .04 .17 .11 .19 90.5 85.6 86.2 ( 9) .35 3 4 .09 .24 .16 -.01 .08 .16 .16 .15 .25 95.8 93.7 93.8 ( 2) .25 4 4 .08 -.01 .14 .02 .16 .20 .05 .10 .09 95.9 93.9 95.1 ( 6) .50 1 5 .12 .00 .14 .05 .23 .06 -.01 .08 .09 87.5 78.4 82.1 ( 5) .50 2 5 .13 .08 .09 -.01 .14 .10 .18 .12 .18 89.5 87.1 84.5 ( 9) .50 3 5 .16 .18 .17 -.01 .12 .19 .13 .13 .17 96.3 94.0 94.4 ( 3) .25 4 5 -.01 .04 .15 .01 .11 .16 .02 .08 .08 92.0 87.4 90.7 ( 3)ridge imth lead w(1)... w(9) CON ensave best mdl
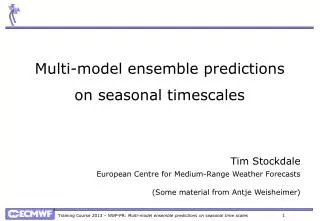
Fig. 1 The potential for improving the monthly mean Nino34 forecast at five month lead. We used a total of 9 models/methods, including all 7 DEMETER models, the NCEP-CFS and Constructed Analogue over the common period 1981-2001. The score of the best single model is in green. The ensemble average (which may suffer if bad models are included) is in red, and the consolidation (which hopefully assigns high/low weights to good/bad models through Ridge Regression) is in blue. There are 4 starts, in February, May, August and October. The word potential is used because the systematic error correction and the weights have not been cross-validated.
Weights from RR-CON are semi-reasonable, semi well-behaved CON better than best mdl in (nearly) all cases (nonCV)Signs of trouble: at lead 5 the straight ens mean is worse than the best single mdl (m=1,3) The ridge regression basically ‘removes’ members that do not contribute. ‘Remove’=assigning near-zero weight. Redo analysis after deleting ‘bad’ member?? YES For increasing lead more ridging is required. Why? Sum of weights goes down with lead (damping so as to minimize rms). Variation of weight as a function of lead (same initial m), .10, .06, -.01, -.01, .12, for mdl is at least a bit strange. Impressions:
Variation of weight as a function of lead (same initial m), .10, .06, -.01, -.01, .12, for one mdl is at least a bit strange. • What to do about it?. … Pool the leads….(1,2,3), (2,3,4) etc Result: • .07,.11,.06,.03,.09 better (not perfect), AND with considerably less ridging. • Demeter cannot pool nearby ‘rolling’ seasons, because only Feb, May, Aug, Nov IC are done. CFS, CCA etc can (to their advantage)
DEMETER + CFS. Equatorial Pacific. Lead 5 Beyond Nino34
Pacific Basin. All gridpoints along the equator. SE correction, and CV-1-out on SE correction and weight calculation Ens Ave Best Mdl RR-CON Starts 2 5 8 11 Lead 1 Lead 5
Closing comments • Consolidation should yield skill >= the best single participating method. Should! In the absence of independent information (orthogonal tools) the equal sign applies. • Consolidation will fail on independent data if hindcasts of at least one method are ‘no good’. • Consolidation will fail on independent data if the real time forecast is inconsistent with the hindcasts. (Computers change!!!; model not ‘frozen’) • To the extent that data assimilation is a good paradigm/analogue to consolidation, please remember ‘we’ worked on data assimilation for 50 years (and no end in sight) • Error bars on correlation are large, so the question whether method A is better than method B (e.g. 0.12 vs 0.09) is hard to settle (perhaps should be avoided). Same comment applies when asking: does method C add anything to what we knew already from A and B. Nevertheless, these questions will be asked.
Conclusions and work left to be done • Ridge Regression Consolidation (RRC) appears to work well in most (not all) cases studied. Some mysteries remain. Left over methodological issues: -) Systematic Error correction -) Cross Validation -) Re-doing RRC after poor performers are forcefully removed (when automated: based on what?) -) Understand the cases where 50% ridging still is not enough -) EOF filter (also good diagnostic)
Separate in hf and lf • Set lf aside • Do consolidation on hf part • Place lf back in
Extra Closing comment 1 • Acknowledge that consolidation, in principle, can be combined with (simple or fancy) systematic error correction approaches. The equation matrix times vector = vector becomes matrix times matrix = matrix. And the data demands are even higher.
.50 1 5 87.5 78.4 82.1 ( 5) ridge imth lead CON ensave best mdlwithout s.e. correction….. (otherwise the same fortran code) .10 1 5 86.4 62.5 63.5 ( 1) ridge imth lead CON ensave best mdl Without a-priori tool-by-tool se correction, the results of CON look phenomenal. “Fold’ se correction into CON???
Extra Closing comment 2 There is tension between consolidation of tools (an objective forecast) on the one hand and the need for attribution on the other. Examples: forecaster writes in the PMD about tools (CCA, OCN…) and wants to explain why the final forecast is what it is. This includes attribution to specific tools and physical causes, like ENSO, trend, soil moisture, local effects… What is the role of phone conferences, impromptu tools and thoughts vis-à-vis an objective CON.
OPERATIONS TO APPLICATIONS GUIDELINESfrom Wayne Higgins’ slide • The path for implementation of operational tools in CPCs consolidated seasonal forecasts consists of the following steps: • Retroactive runs for each tool (hindcasts) • Assigning weights to each tool; • Specific output variables (T2m & precip for US; SST & Z500 for global) • Systematic error correction • Available in real-time • The Path for operational models, tools and datasets to be delivered to a diverse user community also needs to be clear: • NOMADS server • System and Science Support Teams • Roles of the operational center and the applications community must be clear for each step to ensure smooth transitions. • Resources are needed for both the operations and applications communities to ensure smooth transitions.
OPERATIONS TO APPLICATIONS GUIDELINESfrom Wayne Higgins slide • The path for implementation of operational tools in CPCs consolidated seasonal forecasts consists of the following steps: • Some general ‘sanity’ check • Retroactive runs for each tool (hindcasts). Period: 1981-2005. Longer please • Assigning weights to each tool; • Specific output variables (T2m & precip for US; SST & Z500 & Ψ200 for global) • Systematic error correction • Available in real-time (frozen model!, same as hindcasts) • Feedback procedures
Multi-modeling is a Problem of our own making • The more the merrier??? • By method/model: Is all info (even prob. Info) in the ens mean or is there info in case to case variation in ‘spread’ • Signal to noise perspective vs regression perspective • Does RR inoculate against ‘skill’ loss upon CV?
.05 1 1 .16 .01 .03 .00 .10 .26 .02 .00 .28 97.8 96.4 96.5 ( 6).15 2 1 .21 .00 .14 .00 .01 .11 .16 .07 .07 94.4 91.3 90.7 ( 3).05 3 1 .02 .14 .14 .00 .20 .15 .14 .07 .01 96.5 95.5 95.6 ( 7).05 4 1 .35 .04 .19 .00 .07 .28 .08 .14 .20 98.3 98.0 97.4 ( 6).05 1 2 .06 .02 .02 .00 .13 .16 .10 .05 .14 95.5 93.9 91.2 ( 7).10 2 2 .18 .00 .12 .00 .13 .04 .13 .06 .13 90.9 90.2 87.0 ( 3).10 3 2 .13 .22 .18 .00 .01 .12 .23 .14 .03 96.0 95.2 95.3 ( 7).10 4 2 .28 .05 .15 .00 .13 .29 .09 .13 .18 98.4 97.4 97.6 ( 6).15 1 3 .01 .16 .03 .00 .18 .18 .07 .01 .09 91.6 87.5 83.4 ( 3).25 2 3 .23 .08 .05 .00 .10 .00 .14 .09 .16 89.6 87.1 82.6 ( 9).10 3 3 .02 .29 .15 .00 .04 .18 .19 .20 .14 96.2 94.7 94.9 ( 2).15 4 3 .17 -.01 .13 .00 .21 .27 .10 .13 .07 96.6 95.1 96.3 ( 6).15 1 4 -.01 .02 .05 .00 .29 .17 .10 .14 .00 89.5 81.9 81.3 ( 3).40 2 4 .18 -.01 .02 .00 .12 .04 .17 .11 .19 90.5 85.6 86.2 ( 9).15 3 4 .05 .32 .14 .00 .02 .15 .16 .15 .32 96.1 93.7 93.8 ( 2).25 4 4 .08 .00 .14 .00 .16 .20 .06 .10 .09 95.9 93.9 95.1 ( 6).40 1 5 .14 .00 .13 .00 .25 .06 .00 .09 .10 87.6 78.4 82.1 ( 5).10 2 5 .13 .01 .06 .00 .18 .08 .29 .09 .25 90.0 87.1 84.5 ( 9).05 3 5 .17 .29 .22 .00 .08 .23 .03 .07 .21 96.4 94.0 94.4 ( 3).25 4 5 -.01 .04 .15 .00 .11 .16 .03 .08 .08 92.0 87.4 90.7 ( 3) Revised Table when forcefully removing mdl#4, and doing RRC on remaining eight..
One more trick for CON…..the eof filter m1 m2 m3 m4 m5 m6 m7 m8 m9 EV1 .99 1.02 1.01 .98 1.01 1.00 1.01 1.01 .97 93.982 1.04 -.73 -1.02 1.12 -.84 .68 -.85 -.85 1.57 1.943 1.26 -.28 -.06 1.68 -.33 -.66 -.16 .45 -1.93 1.704 1.75 .87 -.93 -1.15 1.34 -.72 -.28 -.79 -.09 .795 .44 .79 -.63 -.83 -1.13 2.11 .38 -.07 -1.11 .606 .65 -.37 1.42 -.80 -.01 .50 -2.19 .86 -.05 .437 .89 .63 .49 -.71 -1.98 -1.33 .67 .62 .74 .338 .60 -2.01 -.85 -.83 .39 .20 .90 1.48 .11 .219 .72 -1.20 1.65 -.34 -.03 .26 .98 -1.77 -.28 .03 m=1, lead=1 m=4, lead=5 (less skill) 1.07 1.02 1.07 .56 1.04 1.08 1.06 1.07 .92 77.67 .07 .70 -.85 2.38 -.50 .15 .61 -.45 -1.13 11.36 .85 1.05 -.34 -1.44 -.64 -.50 1.01 .78 -1.64 4.89 1.06 -.97 -.02 -.17 1.78 .78 -.46 -.79 -1.51 2.48 .56 -1.35 -.26 .58 .73 -2.04 1.06 .73 .30 1.26 .35 1.41 -1.27 -.49 1.04 -.73 .23 -1.54 1.00 1.11 2.30 -.12 -.26 .29 -1.15 -.19 -1.35 .04 .60 .64 .33 -1.25 -1.19 -.48 -.79 1.40 1.56 -.45 .67 .39 .41 -.13 1.97 -.03 -.73 -.51 .92 -1.81 -.11 .18
What else? • Apply to low skill forecasts. NAO, PNA in Demeter-plus. • Apply to CPC tools: OCN, CCA, SMT, CFS, CAS, ‘composites’ ….anything that can be run as a frozen system for 1981-present (and kept up to date in real time). 1000 Q will arise. • Weights feed into Gaussian Kernel Distribution Method
The current way of making prob forecasts Source: Dave Unger. This figure shows the probability shift (contours), relative to 100*1/3rd, in the above normal class as a function of a-priori correlation (R , y-axis) and the standardized forecast of the predictand (F, x-axis). The prob.shifts increase with both F and R. The R is based on a sample of 30, using a Gaussian model to handle its uncertainty.
Diagram of Gaussian kernel density method to form a probability distribution function from individual ensemble forecasts. Four ensemble members are used in this example to produce a consolidation forecast distribution. E represents the spread, Fm is the ensemble mean, and Sz is the standard deviation of the Gaussian kernel distribution. The x-axis represents some forecast variable, such as air temperature in Degrees F, and the y-axis is probability density. Sz is the same for all 4 kernels but the area underneath each kernel varies according to the weight assigned to the member. From Dave Unger
For increasing lead more ridging is required. Why? 1.00 .92 .88 .71 .84 .92 .91 .88 .74 1.32 .90 1 .92 1.00 .89 .77 .86 .93 .95 .91 .80 1.05 .93 2 .88 .89 1.00 .72 .91 .95 .92 .97 .92 .88 .94 3 .71 .77 .72 1.00 .85 .72 .81 .81 .65 1.74 .70 4 .84 .86 .91 .85 1.00 .85 .93 .95 .84 1.31 .88 5 .92 .93 .95 .72 .85 1.00 .91 .92 .85 .79 .94 6 .91 .95 .92 .81 .93 .91 1.00 .98 .83 .93 .92 7 .88 .91 .97 .81 .95 .92 .98 1.00 .87 .90 .93 8 .74 .80 .92 .65 .84 .85 .83 .87 1.00 1.01 .87 9 m=4, lead=5. 50% ridging required to achieve non-ve weights. Why? Don’t know yet.
Weights? • For linear regression?, optimal ‘point’ forecasts (functioning like ensemble means with a pro forma +/- rmse pdf) • Making an ‘optimal’ pdf?
CFS ‘unequal’ members • 5 oldest members 9th, 10, 11, 12, 13 m-1 • 5 middle members 19,20,21,22,23 m-1 • 5 latest members 30,31,1,2,3rd m-1/m • One model, but 15 members. How to weigh them? (or 30 lagged members) The NCEP Climate Forecast System. 2005 : S. Saha, S. Nadiga, C. Thiaw, J. Wang, W. Wang, Q. Zhang, H. M. van den Dool, H.-L. Pan, S. Moorthi, D. Behringer, D. Stokes, M. Pena, G. White, S. Lord, W. Ebisuzaki, P. Peng, P. Xie. Submitted to the Journal of Climate, 1st review finished.
weights ridge imth lead AC oldest middle latest CON ens.ave latest -.09 .27 .38 .50 2 3 86.7 78.4 82.0 .21 .19 .20 .50 3 3 82.2 78.9 69.5
weights ridge imth lead AC oldest middle latest CON ens.ave latest .16 .09 .29 .50 1 3 80.4 76.1 76.7 -.09 .27 .38 .50 2 3 86.7 78.4 82.0 .21 .19 .20 .50 3 3 82.2 78.9 69.5 .21 .19 .24 .50 4 3 88.9 84.4 71.2 .23 .19 .25 .50 5 3 85.6 79.1 81.4 -.08 .46 .43 .50 6 3 94.9 89.6 86.4 .16 .33 .49 .50 7 3 94.0 90.1 90.7 .35 .38 .39 .35 8 3 94.5 92.7 85.1 .33 .58 .31 .25 9 3 96.8 96.3 91.8 .42 .56 .14 .30 10 3 96.1 95.0 89.6 .17 .24 .48 .50 11 3 93.0 90.6 86.5 .30 .23 .16 .50 12 3 89.8 88.9 83.2In contrast to Demeter, CFS has starts in all 12 months, and is up to date.