Download

1 / 16
220 likes | 382 Views
Scatter-plot, Best-Fit Line, and Correlation Coefficient. Definitions:. Scatter Diagrams (Scatter Plots) – a graph that shows the relationship between two quantitative variables. Explanatory Variable – predictor variable; plotted to the horizontal axis (x-axis).

E N D
Definitions: • Scatter Diagrams (Scatter Plots) – a graph that shows the relationship between two quantitative variables. • Explanatory Variable – predictor variable; plotted to the horizontal axis (x-axis). • Response Variable – a value explained by the explanatory variable; plotted on the vertical axis (y-axis).
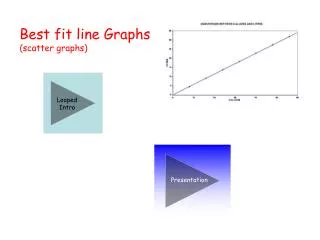
Why might we want to see a Scatter Plot? • Statisticians and quality control technicians gather data to determine correlations (relationships) between two events (variables). • Scatter plots will often show at a glance whether a relationship exists between two sets of data. • It will be easy to predict a value based on a graph if there is a relationship present.
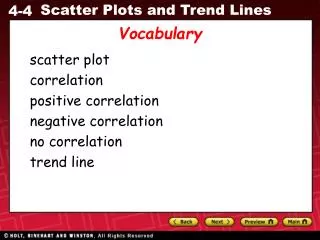
Types of Correlations: • Strong Positive Correlation – the values go up from left to right and are linear. • Weak Positive Correlation - the values go up from left to right and appear to be linear. • Strong Negative Correlation – the values go down from left to right and are linear. • Weak Negative Correlation - the values go down from left to right and appear to be linear. • No Correlation – no evidence of a line at all.
How to create a Scatter Plot: • We will be relying on our TI – 83 Graphing Calculator for this unit! • 1st, get Diagnostics ON, 2nd catalog. • Enter the data in the calculator lists. Place the data in L1 and L2. [STAT, #1Edit, type values in] • 2nd Y= button; StatPlot – turn ON; 1st type is scatterplot. • Choose ZOOM #9 ZoomStat.
The Correlation Coefficient: • The Correlation Coefficient (r) is measure of the strength of the linear relationship. • The values are always between -1 and 1. • If r = +/- 1 it is a perfect relationship. • The closer r is to +/- 1, the stronger the evidence of a relationship.
The Correlation Coefficient: • If r is close to zero, there is little or no evidence of a relationship. • If the correlation coef. is over .90, it is considered very strong. • Thus all Correlation Coefficients will be: -1< x < 1
Find the Equation and Correlation Coefficient • Place data into L1 and L2 • Hit STAT • Over to CALC. • 4:Linreg(ax+b) • Is there a High or Low, Positive or Negative correlation?
Finding the Line of Best Fit: • STAT → CALC #4 LinReg(ax+b) • Include the parameters L1, L2, Y1 directly after it. • (Y1 comes from VARS → YVARS, #Function, Y1) • Hit ENTER; the equation of the Best Fit comes up. Simply hit GRAPH to see it with the scatter.
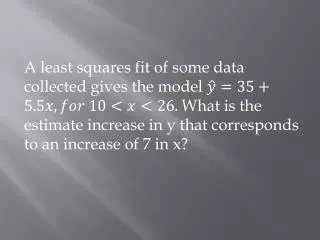
Using the Best-Fit Line to Predict. Once your line of “Best fit” is drawn on the calculator, it can be used to predict other values. On the TI-83/84: • 2nd Calc • 1:Value • x= place in value
Hypothesis Testing: • Is there evidence that there is a relationship between the variables? • To test this we will do a TWO-TAILED t-test • Using Table 5 for the level of Significance, and d.f. = n – 2; degrees of freedom. • Compare the answer from the following formula to determine if you will REJECT a particular correlation.