Download
1 / 43
440 likes | 599 Views
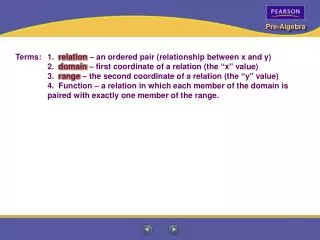
Terms: 1. relation – an ordered pair (relationship between x and y ) 2. domain – first coordinate of a relation (the “ x ” value) 3. range – the second coordinate of a relation (the “ y ” value )

E N D
Terms: 1. relation – an ordered pair (relationship between x and y) 2. domain – first coordinate of a relation (the “x” value) 3. range – the second coordinate of a relation (the “y” value) 4. Function – a relation in which each member of the domain is paired with exactly one member of the range.
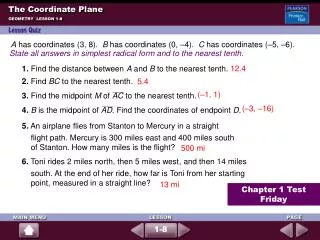
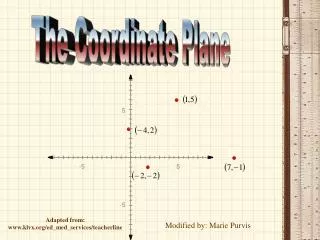
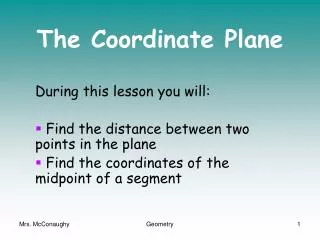
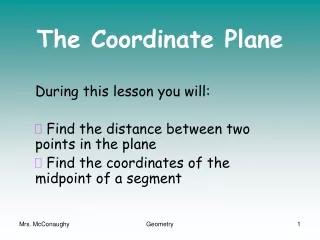
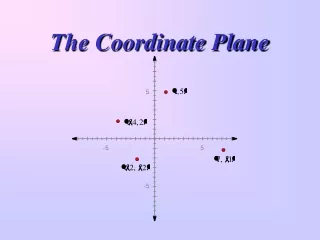
The Coordinate Plane Lesson 1-10 Write the coordinates of point G. In which quadrant is point G located? Point G is located 2 units to the left of the y-axis. So the x-coordinate is –2. The point is 3 units below the x-axis. So the y-coordinate is –3. The coordinates of point G are (–2, –3). Point G is located in Quadrant III.
The Coordinate Plane Lesson 1-10 Graph point M(–3, 3).
Relations and Functions Lesson 8-1 Is each relation a function? Explain. a. {(0, 5), (1, 6), (2, 4), (3, 7)} List the domain values and the range values in order. Draw arrows from the domain values to their range values. There is one range value for each domain value. This relation is a function.
Relations and Functions Lesson 8-1 (continued) b. {(0, 5), (1, 5), (2, 6), (3, 7)} There is one range value for each domain value. This relation is a function.
Relations and Functions Lesson 8-1 (continued) c. {(0, 5), (0, 6), (1, 6), (2, 7)} There are two range values for the domain value 0. This relation is not a function.
Relations and Functions Lesson 8-1 Is the time needed to mow a lawn a function of the size of the lawn? Explain. No; two lawns of the same size (domain value) can require different lengths of time (range values) for mowing.
Graph the ordered pairs (–3, 5), (–5, 3), (3, 5), and (5, 3). Relations and Functions Lesson 8-1 a. Graph the relation shown in the table. Domain Value –3 –5 3 5 Range Value 5 3 5 3
Pass a pencil across the graph as shown. Keep the pencil vertical (parallel to the y-axis) to represent a vertical line. Relations and Functions Lesson 8-1 (continued) b. Use the vertical-line test. Is the relation a function? Explain. The pencil does not pass through two points at any one of its positions, so the relation is a function.
y = 4(2) – 3 Replace x with 2. y = 8 – 3 Multiply. y = 5 Subtract. Equations With Two Variables Lesson 8-2 Find the solution of y = 4x – 3 for x = 2. y = 4x – 3 A solution of the equation is (2, 5).
a = 5 + 3(4) Replace p with 4. a = 5 + 12 Multiply. a = 17 Add. Equations With Two Variables Lesson 8-2 The equation a = 5 + 3p gives the price for admission to a park. In the equation, a is the admission price for one car with p people in it. Find the price of admission for a car with 4 people in it. a = 5 + 3p A solution of the equation is (4, 17). The admission price for one car with 4 people in it is $17.
x 4x – 2 (x, y) –2 4(–2) – 2 = –8 – 2 = –10 (–2, –10) 0 4(0) – 2 = 0 – 2 = –2 (0, –2) 2 4(2) – 2 = 8 – 2 = 6 (2, 6) Graph the ordered pairs. Draw a line through the points. Equations With Two Variables Lesson 8-2 Graph y = 4x – 2. Make a table of values to show ordered-pair solutions.
For every value of x, y = –3. For every value of y, x = 4. Equations With Two Variables Lesson 8-2 Graph each equation. Is the equation a function? a.y = –3 b.x = 4 This is a horizontal line. This is a vertical line. The equation y = –3 is a function. The equation y = 4 is not a function.
1 2 1 2 1 2 1 2 Solve the equation for y. y – x = 3 1 2 1 2 1 2 y – x+ x = 3 + x Add x to each side. y = x + 3 Simplify. Equations With Two Variables Lesson 8-2 Solve y – x = 3 for y. Then graph the equation.
Make a table of values. Graph. 1 2 xx + 3 (x, y) –2 (–2) + 3 = –1 + 3 = 2 (–2, 2) 0 (0) + 3 = 0 + 3 = 3 (0, 3) 2 (2) + 3 = 1 + 3 = 4 (2, 4) 1 2 1 2 1 2 Equations With Two Variables Lesson 8-2 (continued)
Slope and y-intercept Lesson 8-3
rise run 4 1 rise run –6 3 slope = = = 4 slope = = = –2 Slope and y-intercept Lesson 8-3 Find the slope of each line. a. b.
difference in y-coordinates difference in x-coordinates 0 – 5 –2 – 7 –5 –9 5 9 slope = = = = Slope and y-intercept Lesson 8-3 Find the slope of the line through E(7, 5) and F(–2, 0).
–3 – (–3) 4 – (–2) 0 6 –1 – 3 –2 – (–2) –4 0 slope = = = 0 slope = = Slope and y-intercept Lesson 8-3 Find the slope of each line. a. b. Slope is 0 for a horizontal line. Division by zero is undefined. Slope is undefined for a vertical line.
1 5 1 5 Step 2: Since the slope is – , move 1 unit down from (0, 4). Then move 5 units right to graph a second point. Slope and y-intercept Lesson 8-3 A ramp slopes from a warehouse door down to a street. The function y = – x + 4 models the ramp, where x is the distance in feet from the bottom of the door and y is the height in feet above the street. Graph the equation. Step 1: Since the y-intercept is 4, graph (0, 4). Step 3: Draw a line through the points.
number of minutes Words total bill is $4.95 plus 9¢ times Let = the number of minutes. m Let = total bill, a function of the number of minutes. t( m ) Rule t( m ) = 4.95 + • m 0.09 Writing Rules for Linear Functions Lesson 8-4 A long-distance phone company charges its customers a monthly fee of $4.95 plus 9¢ for each minute of a long-distance call. a. Write a function rule that relates the total monthly bill to the number of minutes a customer spent on long-distance calls. A rule for the function is t(m) = 4.95 + 0.09m.
t(90) = 4.95 + 0.09(90) Replace m with 90. t(90) = 4.95 + 8.10 Multiply. t(90) = 13.05 Add. Writing Rules for Linear Functions Lesson 8-4 (continued) b. Find the total monthly bill if the customer made 90 minutes of long-distance calls. t(m) = 4.95 + 0.09m The total monthly bill with 90 minutes of long-distance calls is $13.05.
x 2 0 –2 –4 f(x) 3 –5 –13 –21 As the x values decrease by 2, the f(x) values decrease by 8. –2 –2 –2 –8 –8 –8 –8 –2 So m = = 4. Writing Rules for Linear Functions Lesson 8-4 Write a rule for the linear function in the table below. When x = 0, f(x) = –5. So b = –5. A rule for the function is f(x) = 4x – 5.
–2 – 2 0 – 2 –4 –2 slope = = = 2 Writing Rules for Linear Functions Lesson 8-4 Write a rule for the linear function graphed below. y-intercept = –2 A rule for the function is f(x) = 2x – 2.
Scatter Plots Lesson 8-5 The scatter plot shows education and income data. a. Describe the person represented by the point with coordinates (10, 30). This person has 10 years of education and earns $30,000 each year. b. How many people have exactly 14 years of education? What are their incomes? The points (14, 50), (14, 80), and (14, 90) have education coordinate 14. The three people they represent earn $50,000, $80,000, and $90,000, respectively.
Elevation Above Sea Level (ft) Mean Annual Precipitation (in.) City 1,050 20 596 18 11 1,072 75 40 1,305 Atlanta, GA Boston, MA Chicago, IL Honolulu, HI Miami, FL Phoenix, AZ Portland, ME San Diego, CA Wichita, KS 51 42 36 22 56 8 44 10 29 Scatter Plots Lesson 8-5 Use the table to make a scatter plot of the elevation and precipitation data.
Scatter Plots Lesson 8-5 Use the scatter plot below. Is there a positive correlation, a negative correlation, or no correlation between temperatures and amounts of precipitation? Explain. The values show no relationship. There is no correlation.
Year Wolf Moose Year Wolf Moose Year Wolf Moose 1982 1983 1984 1985 1986 1987 14 23 24 22 20 16 700 900 811 1,062 1,025 1,380 1988 1989 1990 1991 1992 1993 12 11 15 12 12 13 1,653 1,397 1,216 1,313 1,600 1,880 1994 1995 1996 1997 1998 1999 15 16 22 24 14 25 1,800 2,400 1,200 500 700 750 Problem Solving Strategy: Solve by Graphing Lesson 8-6 Use the data in the table below. Suppose this year there are 16 wolves on the island. Predict how many moose are on the island. Isle Royale Populations
Step 1: Make a scatter plot by graphing the (wolf, moose) ordered pairs. Use the x-axis for wolves and the y-axis for moose. Step 2: Sketch a trend line. The line should be as close as possible to each data point. There should be about as many points above the trend line as below it. Problem Solving Strategy: Solve by Graphing Lesson 8-6 (continued)
Look up to find the point on the trend line that corresponds to 16 wolves. Then look across to the value on the vertical axis, which is about 1,300. Problem Solving Strategy: Solve by Graphing Lesson 8-6 (continued) Step 3: To predict the number of moose when there are 16 wolves, find 16 along the horizontal axis. There are about 1,300 moose on the island.
Check: See whether (–3, –10) makes both equations true. y = x – 7 y = 4x + 2 Replace x with – 3 and y with –10. –10–3 – 7 –10 4(–3) + 2 –10 = –10 The solution checks. –10 = –10 Solving Systems of Linear Equations Lesson 8-7 Solve the system y = x – 7 and y = 4x + 2 by graphing. Step 1: Graph each line. Step 2: Find the point of intersection. The lines intersect at one point, (–3, –10). The solution is (–3, –10).
Solving Systems of Linear Equations Lesson 8-7 Solve each system of equations by graphing. a. 27x + 9y = 36; y = 4 – 3x b. 8 = 4x + 2y; 2x + y = 5 The lines are the same line. There are infinitelymany solutions. The lines are parallel. They do not intersect. There is no solution.
Step 1: Write equations. Let x = the greater number. Let y = the lesser number. Equation 1 Sum is 10. x + y = 10 Equation 2 Difference is 2. x – y = 2 Step 2: Graph the equations. The lines intersect at (6, 4). The numbers are 6 and 4. Solving Systems of Linear Equations Lesson 8-7 Find two numbers with a sum of 10 and a difference of 2.
Solving Systems of Linear Equations Lesson 8-7 (continued) Check: Since the sum of 6 and 4 is 10 and the difference of 6 and 4 is 2, the answer is correct.
Step 1: Graph the boundary line. Points on the boundary line do not make y > 2x + 1 true. Use a dashed line. Graphing Linear Inequalities Lesson 8-8 Graph each inequality on a coordinate plane. a.y > 2x + 1
? ? > > y > 2x + 1 0 2(0) + 1 Substitute. 0 0 + 1 0 > 1 false Graphing Linear Inequalities Lesson 8-8 (continued) Step 2: Test a point not on the boundary line. Test (0, 0) in the inequality. Since the inequality is false for (0, 0), shade the region that does not contain (0, 0).
< < – – Step 1: Graph the boundary line. Points on the boundary line make y 3x – 2 true. Use a solid line. Graphing Linear Inequalities Lesson 8-8 (continued) b.y 3x – 2
? ? < < – – < < – – y 3x – 2 0 3(3) – 2 Substitute. 0 9 – 2 0 7 true Graphing Linear Inequalities Lesson 8-8 (continued) Step 2: Test a point not on the boundary line. Test (3, 0) in the inequality. Since the inequality is true for (3, 0), shade the region containing (3, 0).
< – Step 1: Write an inequality. cost of cashews cost of pecans is at most twenty dollars Words plus Let = number of pounds of cashews. y Let = number of pounds of pecans. x Inequality 2y + 4x 20 Graphing Linear Inequalities Lesson 8-8 Cashews cost $2/lb. Pecans cost $4/lb. You plan to spend no more than $20. How many pounds of each can you buy?
< < – – Step 2: Write the equation of the boundary line in slope-intercept form. 2y + 4x 20 y –2x + 10 y = –2x + 10 Step 3: Graph y = –2x + 10 in Quadrant I since weight is not negative. Graphing Linear Inequalities Lesson 8-8 (continued)
? < – < < – – Step 4: Test (1, 1). y –2x + 10 1 –2(1) + 10 1 8 The inequality is true. (1, 1) is a solution. Step 5: Shade the region containing (1, 1). Graphing Linear Inequalities Lesson 8-8 (continued) The graph shows the possible solutions. For example, you could buy 1 pound of pecans and 5 pounds of cashews.
> > – – Step 1: Graph yx + 1 on a coordinate plane. Shade in red. Step 2: Graph y < 2x + 3 on the same coordinate plane. Shade in blue. Graphing Linear Inequalities Lesson 8-8 Solve the system yx + 1 and y < 2x + 3 by graphing.
? < ? > > > – – – Check: See whether the solution (2, 5) makes both of the inequalities true. yx + 1 5 2 + 1 Replace x with 2 and y with 5. 5 3yThe solution checks. y < 2x + 3 5 2(2) + 3 Replace x with 2 and y with 5. 5 < 7yThe solution checks. Graphing Linear Inequalities Lesson 8-8 (continued) The solutions are the coordinates of all the points in the region that is shaded in both colors.